- Glossaries
- Crypto Info
- What's New
- What Is BOT (BOT): The AI Trading Coin Powering Multi-DEX Execution
- Ondo Tokenized Stocks: Pioneering the Future of Real-World Asset (RWA) Tokenization
- World Liberty Financial (WLFI) Price Prediction 2025, 2026–2030
 Ondo (ONDO) Price Prediction 2025,2026-2030
- Somnia (SOMI) Price Prediction 2025, 2026–2030
- What Is Mitosis (MITO): A Revolutionary Layer-1 Blockchain for Decentralized Crypto Liquidity
- What Is CAMP (CAMP): A Comprehensive Guide to Camp Network
- Top 5 Potential Dog-Themed Meme Coins in 2025
- Dolomite (DOLO) Crypto Price Prediction 2025, 2026-2030
- DIMO (DIMO) Crypto Price Prediction 2025, 2026-2030
- Numerai (NMR) Crypto Price Prediction 2025, 2026-2030
- What Is Bitlayer (BTR): The First Bitcoin Layer 2 for Secure and Scalable DeFi
- SpaceXCoin Price Prediction 2025, 2026-2030
- Neon EVM Price Prediction 2025, 2026-2030
- Bio Protocol Price Prediction 2025, 2026-2030
- What Is SAPIEN (Sapien): A Guide to the Decentralized AI Data Token
- Bitcoin Cash (BCH) Price Prediction 2025, 2026-2030
- Freedom Dollar (FUSD): Privacy-Focused Algorithmic Stablecoin on Zano Blockchain
- Ethereum (ETH) Price Prediction 2025 Year End Analysis
- Tree (TREE) Crypto Price Prediction 2025, 2026-2030
- What is Codatta (XNY)? Exploring the Decentralized AI Knowledge Protocol
- ZORA Rockets 50% in 24 Hours: What’s Behind the Creator-Coin Craze?
- What Is INFINIT (IN) Token? Unlocking Governance, Staking, and DeFi Opportunities
- Ethereum (ETH) Update: Why Ethereum’s Price is Going Up Today?
- Unifi Protocol DAO (UNFI) Price Prediction 2025, 2026-2030
- Ethervista (VISTA) Price Prediction 2025, 2026-2030
- Mog Coin Price Prediction: Is MOG Headed for a Breakout or Breakdown?
- Omni Network Price Prediction 2025, 2026 - 2030
- Mamo (MAMO) Price Prediction: Will AI-Powered Blockchain Agents Define the Next Web3 Cycle?
- Towns (TOWNS) Price Prediction: Redefining Decentralized Digital Communities
- Top 5 Potential Cat-Themed Meme Coins for the Second Half of 2025
- What Is Ika (IKA)? Exploring the Fastest MPC Network on Sui Blockchain
- Eclipse Network: Ethereum’s Security Meets Solana’s Speed
- Brilliant Crypto Token (BRIL) Price Prediction 2025, 2026-2030
- BONK (BONK) Price Prediction 2025, 2026-2030
- How Much is 1 Pi Coin Worth in USD? Latest Pi Price for Nigeria
- Cardano (ADA) Price Prediction 2025, 2026–2030
- GMX (GMX) Price Prediction 2025–2030
- Monero (XMR) Price Prediction 2025, 2026-2030
- Mantle (MNT) Price Prediction 2025, 2026-2030
- What Is the Stablechain for USDT? Your Guide to Tether Blockchain Ecosystem
- What Is StablR Euro (EURR): The Ultimate Guide to Euro-Backed Blockchain Transactions
- USDR and the Future of Stablecoins: Regulation, Transparency, and Trust in a Digital Dollar
- What is Quantoz EURQ? Exploring the Digital Euro Stablecoin Revolution
- What Is PPKAS? Discover the Meme Token Revolution on the Kaspa Network
- BLOCK (BLOCK) Price Prediction 2025, 2026-2030 Will BlockProtocol Rebound After a 99% Drop?
- Baby Doge Coin (BABYDOGE) Price Prediction 2025, 2026-2030 Will the Meme Coin Make a Comeback, or Fade Further?
- KREX (KREX) Price Prediction 2025, 2026-2030
- Fartcoin: The Unique Meme With “Fart” Transaction Sounds
- Polygon (POL) Price Prediction 2025, 2026-2030
-
- AI Agent
- What Is GIZA? Explore the Power of the Future of AI-Driven DeFi
- BankrCoin (BNKR): Everything You Need to Know the AI-Powered Token
- ai16z (AI16Z) Price Prediction 2025-2030: A Comprehensive Analysis
- What Is ai16z? Understanding AI Agent Ecosystem on Solana
- DIN Token: Powering the Future of AI dApps
- Explore MyShell: A Decentralized Platform for AI Creators and Users
- Deep Exploration of VaderAI by Virtuals
- Prefrontal Cortex Convo Agent (CONVO): A Revolutionary AI-Driven Coin
- BrianknowsAI: Unleashing the Power of Web3 Intents with AI
- Zerebro and Its Impact on the AI-Agent Community
- Paal Labs: Revolutionizing AI for Cross-Platform Integration
- AINTIVIRUS Token: Your Path to Digital Freedom
- Funding Government Accountability with DOGEAI Token
- DREAMS Token: AI Agents for Blockchain Gaming
- Is QudeAI Framework (QUDE) the next Big Thing in AI Agent Creation?
- AIXBT by Virtuals (AIXBT) Price Prediction 2025, 2026–2030
- Soul Graph: Transforming AI Agents into Memorable Companions
- Unlock the Future with Moemate: Your AI Companion Awaits
- Moby AI: The Ultimate Crypto Copilot Powered by AI
- SPERG AI Agents: Your New Allies in Crypto Trading Success
- Introduction to Hiero Terminal and the Multi-Chain AI Agent Project
- StealthSDK: Transforming Gaming with AI and Crypto
- Introduction to gAInz: The Health AI-Agent on Solana
- How MAX Token Transforms AI Agents on Solana
- Introducing Vvaifu: Powering AI Agent Management with Blockchain Innovation
- What Is Yesnoerror and How to Buy YNE?
- Exploring ZAILGO: The AI Meme Coin Revolution on Solana
- Freysa AI (FAI): The World's First Adversarial Agent Game on Base Chain
- Exploring the Impact of AI on Cryptocurrency with METAV
- Spore.fun: Redefining Autonomous AI Evolution
- Discover AI Rig Complex (ARC) – a Unique Meme Coin Project
- REALIS Token and the AI-Driven Metaverse: A Bold Promise or Just Hype?
- GOATS (Goatseus Maximus): The Meme Coin of the Herd
- Discover GRIFFAIN: The Future of AI Agents in the Crypto World
- OPUS Price Analysis: What Traders Should Know About This AI Meme Coin
- O Coin Project Explained: Is It the next Big Thing in Decentralized AI?
- BULLY: An AI Meme on Solana and How to Buy on CoinEx
- AIXBT Cryptocurrency: Riding the AI Wave on the Base Chain
- Fetch.ai (FET) Price Prediction 2024, 2025-2030
- Introducing MemesAI: Where AI Meets Meme Culture on the Blockchain
- Exploring ELIZACTO: A Deep Dive into ai16zeliza
- The Emergence of AI Memecoins: What's All the Hype About?
- Zerebro Crypto: All You Need To Know About This Crypto
- Why Are AI Meme Coins Gaining Popularity?
- Exploring WORM: A Deep Dive into Deep Worm
- Exploring GOAT Token: A Deep Dive into the Meme Coin Phenomenon on Solana
- What Is Delysium and How to Buy AGI Tokens?
- About Spectral (SPEC) Cryptocurrency
- What Is PAAL AI and How to Buy PAAL Tokens?
- Fetch.ai: The Decentralized AI Platform
-
- Bitcoin Ecosystem
- What Is Resolv USR: Decoding the Delta-Neutral Stablecoin
- Deep Dive into B2: Unlocking Bitcoin's Next Layer of Innovation
- Analyzing Bitcoin Price Trends Through URPD: Will the Bull Market Continue in 2025 or Will Bitcoin Return to a Bear Market?
- Lorenzo Protocol: Unlocking Bitcoin’s True Power Through Liquid Staking and DeFi
- What Is BRC-20: A New Way to Create Tokens on Bitcoin
- Babylon: Revolutionizing Bitcoin Staking and Blockchain Security
- Bitcoin Crash 28% Drop: 2025 Bear Market Insights & Recovery Strategies
- Pell Network Token (PELL): An Innovative BTC Restaking Ecosystem
- Bitcoin Cash (BCH) Price Prediction 2025, 2026-2030
- BTC vs XRP: Key Differences and Which One to Invest In?
- Bitcoin vs. Gold: Investment Strategies amid Market Uncertainty
- What are SRC-20 tokens and Bitcoin Stamps? A Comprehensive Guide
- Avalon (AVL): Revolutionizing Bitcoin’s Financial Future
- BTC vs ETH: Key Differences and Which One to Invest In 2025
- Runecoin: Exploring BTC Potential on the Rune
- Is Merlin Starter (MSTAR) the Future of Crypto Fundraising? Here’s What You Need to Know
- What Is BakerySwap and How to Buy BAKE Tokens?
- The Rise of Rune Coins: How Bitcoin's New Concept Surpassed $1.4 Billion Market Cap
- DECENTRALIZED: All About the New Rune Token on Bitcoin
- Exploring SEAL Token: A Deep Dive into Seal2Earn
- What Is Bitcoin Cash and How to Buy BCH?
- What Is Ordinals and How to Buy ORDI Tokens?
- What Is ECash and How to Buy XEC Tokens?
- What Is Wrapped BTC (wBTC)?
- What Is Stacks and How to Buy STX Tokens?
- XSAT Crypto: A New Revolution for the Bitcoin Ecosystem
- Bitcoin (BTC) Price Prediction 2025-2030: Analyzing BTC Future in The Trump Effect
- Nubit: Bridging the Gap Between Web2 and Web3 with Bitcoin’s Power
- FBCAT: A Deep Dive into Covenant-Attested Token
- Fractal Bitcoin's Impact on DeFi and NFTs
- The Development Challenges of Miners After the Bitcoin Halving: Challenges, Survival, Adaptation, and Preparation
- What Is Bitcoin Satoshi Vision and How to Buy BSV Coins?
- How to Send Bitcoins Safely?
-
- Ethereum
- Ondo Tokenized Stocks: Pioneering the Future of Real-World Asset (RWA) Tokenization
- World Liberty Financial (WLFI) Price Prediction 2025, 2026–2030
- Ethereum (ETH) Update: Why Ethereum’s Price is Going Up Today?
- Ethervista (VISTA) Price Prediction 2025, 2026-2030
- Omni Network Price Prediction 2025, 2026 - 2030
- Towns (TOWNS) Price Prediction: Redefining Decentralized Digital Communities
- How Much is 1 Pi Coin Worth in USD? Latest Pi Price for Nigeria
- Cardano (ADA) Price Prediction 2025, 2026–2030
- What Is Pepes Dog (ZEUS)? The Meme-Legacy Token Powering on Ethereum
- What’s Driving ETH’s Recent $2500 Surge? Pectra Upgrade and Shifting Stakeholders
- Introduction to Obol Network: Enhancing Ethereum Staking Through Decentralized Infrastructure
- SuperVerse (SUPER) Price Prediction 2025, 2026-2030
- What Is MCP: Advancing AI Integration in Crypto Projects
- Voxies VOXEL Price Prediction 2025-2030 Guide
- NKN Price Prediction 2025 - Future Value Analysis
- Clanker: Redefining Token Creation with AI and Blockchain
- Top RWA TVL Rankings: Leading Protocols & Trends in On-Chain Assets
- Zora: Redefining NFT Marketplaces with Creator-Centric Innovation
- What Is MEV and How Does It Impact Solana and Ethereum?
- Hyperlane (HYPER) Price Prediction 2025, 2026-2030
- Major Token Unlocks: MRS, VENOM, MURA, and IOTA – What Investors Need to Know
- Deep Dive into Hyperlane: Building the Future of Blockchain Interoperability
- WalletConnect Token (WCT) Price Prediction 2025, 2026-2030
- Deep Dive into Initia: A Multi-Chain Ecosystem Revolution
- ETH vs SOL: Key Differences and Which One to Invest In?
- Ethereum’s Future in Question: Vitalik Buterin vs. Decentralization Advocates
- Ethereum (ETH) Price Prediction 2025 Year End Analysis
- Eigen Layer: Redefining Ethereum Staking
- Exploring Swell Network: A Deep Dive into Liquid Staking and the SWELL Token
- Understanding Mollars: A Revolutionary Store of Value on Ethereum
- Unlocking New Potential with EigenLayer Restaking
- What Is Fuel OS for Ethereum Rollups?
- Introduction to Soneium Mechanism and Functionalities
- Corn: The Premier Yield Network Powered by Digital Gold
- What Is Smart Layer and How to Buy SLN Tokens?
- What is Defactor and How to Buy FACTR Tokens?
- What Is Tether Gold and How to Trade XAUT?
- What Is SKALE Network and How to Buy SKL?
- What Is Push Protocol and How to Buy PUSH Coins?
- Unveiling the Blast: Ethereum Layer-2's New Era
- Is BLAST the Next High Return L2 Project on Ethereum?
- Top Crypto Altcoins Trades to Capitalize on the Spot Ethereum ETF
- Everything You Need to Know About ETH ETFs
- What Is Mantle Network and How to Trade MNT Tokens?
- What Is Quant and How to Buy QNT Tokens?
- What Is Ethereum Classic and How Is It Different From Ethereum?
- What Is Request and How to Buy REQ Tokens?
- What Is ApeCoin and How to Buy APE?
- What Is JasmyCoin and How to Buy JASMY?
- What Is DENT Crypto and DENT Token?
- With Bullish Factors like Deflation and Futures, When will ETH hit $5,000?
- Nine New Highs Suggesting A Bright Future of Ethereum
-
- PayFi
- ZBCN (Zebec Network) Price Prediction 2025–2030
- What Is Huma Finance? Exploring the First PayFi Network for Global Payments
- XRP: The Crypto Challenger to SWIFT's Dominance
- Exploring XRP: A Crypto for Global Payments
- What Is XRP and How to Buy XRP?
-
- PoW
- Monero (XMR) Price Prediction 2025, 2026-2030
- SEC’s PoW Statement: A Potential Catalyst for BTC, DOGE, and LTC Price Growth in 2025
- Quai Network (QUAI): A Deep Dive into Scalable Blockchain Innovation
- Quai Network: A New Global Monetary System
- Epic Cash Cryptocurrency: Learn How Epic Cash Is Changing Privacy in Blockchain
- Horizen Halving and New Tokenomics: A Catalyst for ZEN's Price Stability and Growth
- ZCash (ZEC) Halving: The next Major Halving and Trading Opportunity
- Exploring SAL Token: A Deep Dive into Salvium
- ZEPH: Harnessing PoW to Create a Privacy-Centric Stablecoin
- Exploring the World of $BELLS Coins: A PoW Meme Coin Adventure
- SATOX Coins: Bridging Gaming and PoW Blockchain
- Introducing KylaCoin: Open Source P2P Money and Blockchain Ecosystem
- What Is ORE and How to Buy ORE Coins?
- What Is Iron Fish and How to Buy IRON Coins?
- What Is Radiant and How to Buy RXD Coins?
- What Is Syscoin and How to Get SYS?
- Gram: The Pioneering Proof-of-Work Jetton on the TON Blockchain
- Exploring the Technological Advancements Behind Zano Coin
- Revolutionizing Crypto Payments: How Hacash (HAC) is Overcoming Bitcoin’s Scalability Issues
- Everything You Need to Know about the New Mining Coin, WQUIL
- What Is Neoxa and How to Buy NEOX Tokens?
- What Is Starcoin and How to Buy STC Tokens?
- What Is Nervos Network and How to Buy CKB Tokens?
- What Is EthereumPoW and How to Buy ETHW?
- Litecoin Halving: How to Trade LTC In 2023?
- What Is NEXA Blockchain and How to Buy NEXA?
- What Is Ravencoin Blockchain and How to Buy RVN Coins?
- What Is New-Kind-of-Network (NKN) and How to Buy NKN?
- What Is Kadena and How to Buy KDA?
- What Is Vertcoin and How to Buy VTC?
- A New PoW Leader? Guide to KAS Economic Model and Market Data
- CoinEx Academy: Kaspa, a Rising New Star
- From a Nothing to a Market Favorite, Does KAS Just Luck out or Prosper as Destined?
- KAS (Kaspa):A New Choice for GPU Miners After the ETH Merge
- Like A Turtle Sticking Out Its Neck and Moving Forward, Geeks’ TRTL Makes Progress Step by Step
-
- PoS
- EOS (EOS) Price Prediction 2025–2030: Deep Dive into a Scalable Smart Contract Platform
- Babylon (BABY) Price Prediction 2025, 2026-2030
- Particle Network Explained: The Chain Abstraction Through Universal Accounts
- Bitcoin Staking: An Overview of Babylon Labs
- Aptos Price Prediction 2024-2030: Insights and Analysis
- Tezos (XTZ) Price Prediction: A Comprehensive Analysis for 2025-2030
- Avalanche Price Prediction: 2024, 2025, 2030
- TRX: Exploring the Power Behind the TRON Ecosystem
- SocialFi: What Is Limewire and How to Buy LMWR Tokens?
- What Is Lido DAO and How to Buy LDO Tokens?
- What Is Everscale and How to Buy EVER Tokens?
- All You Should Know - What Is Harmony One
- What Is Synthetix and How to Buy SNX Tokens?
- Cardano: A Formidable Competitor to Ethereum with a Thriving Ecosystem
- What Is Avalanche and How to Buy AVAX?
- What Is Cardano (ADA)?
- What Is Terra Classic and How to Buy LUNC?
- What Is Evmos and EVMOS Token?
- What Is Songbird and How to Buy SGB?
- How Does ADA Solve the Impossible Triangle?
- How Did ADA Achieve A 30-fold Increase in Just One Year?
-
- TON
- Duckchain (DUCK) Price Prediction 2025-2030: A Comprehensive Analysis
- TCAPY: A Revolutionary Step in Tokenized Yield Optimization
- The Open Network (TON) Introduction
- Toncoin (TON) Price Prediction 2024, 2025-2030
- Notcoin (NOT) Price Prediction 2024, 2025-2030
- Exploring WAT Token: A Deep Dive into Watcoin
- Hamster Kombat (HMSTR): The Rising Star in Crypto Gaming
- Pina Mania: Revolutionizing Gaming with the First ServerFi Model on the TON
- Explosive Growth: How TON and Solana Ecosystems Are Revolutionizing the Meme Coin Market
- What Is Notcoin and How to Trade NOT Tokens?
- Top 10 TON Ecosystem Projects and How to Buy Those Tokens
- TON Ecosystem Memecoins Show Explosive Growth: These Are the Ones You Need to Check Out
- Is STON Going to Be the Next Flagship Project on the TON Blockchain?
- TON Is Building a Strong Network across Usages, Between the Real and Virtual World
- TON Is Growing Its Impact with Notcoin Introduced
- What Is Toncoin and How to Buy TON?
-
- DePin
- Top DePIN Projects to Watch in 2025
- Is This a New Start for Filecoin Supremacy? a Deep Dive into Filecoin
- The PEAQ Network and PEAQ Token: Revolutionizing the Machine Economy
- What Is Helium Mobile and How to Buy MOBILE Tokens?
- Understanding NATIX Network and How to Trade on CoinEx?
- What Is the IOTX Platform (IOTX)?
- Mining Cloud Storage Project: All You Need to Know About SCP
- Bluzelle (BLZ): The Blockchain for GameFi
- What Is Livepeer and How to Buy LPT?
- What Is Flux Network and How to Buy FLUX?
- What Is Filecoin and How to Buy FIL?
- What Is Helium Network and How to Buy HNT?
- DEX
- Orca (ORCA) Price Prediction 2025, 2026-2030
- What Is KiloEx (KILO): Revolutionizing Perpetual DEX Trading on BNB Chain
- What Is APX Finance (APX): A Top BSC Orderbook DEX with High Growth Potential
- Kodiak: Berachain’s Native Liquidity Hub
- Hyperliquid: Bridging Social Engagement and NFTs in the DeFi Landscape
- The Future of DeFi: HyperSwap, Kittenswap, and Curve Finance
- Breaking down PURR: The First Spot Launch on Hyperliquid L1
- Introducing SatoshiDEX: Pioneering the First Bitcoin-Centric DEX
- Uniswap: The Leading DEX Revolutionizing Trading
- LEO Token: Navigating Market Cycles with Utility-Driven Strength
- Exploring the CoinEx Ecosystem: $CET
- DeepBook (DEEP): All You Need To Know About DeepBook
- What Is Minswap and How to Buy MIN Tokens?
- How Does Flare Finance Revolutionize Web3 and DeFi?
- What Is IDEX and How to Buy IDEX Tokens?
- RabbitX: Trade and Earn with Decentralized Pepertuals
- What Are DEX Crypto Tokens and Best DEX Tokens?
- ORDER Token: A Deep Dive into Orderly Network
- Everything You Need to Know about the ZEX Coin
- What Is Cetus DEX and How to Buy CETUS?
- What Is the Curve Platform and How to Buy CRV?
- What Is Ellipsis (EPX) Coin?
-
- AI & Big Data
- Meet KAITO: Real-Time Alpha for the Crypto World
- MEET48 (IDOL): Transforming Web3 Idol Culture with AI
- Crypto Intelligence Reimagined: AIXBT's Role
- Virtuals Protocol: Powering Al Autonomy Across Blockchains
- What Is AGT: Unpacking a Rising Star in Decentralized AI
- Privasea.ai: Pioneering the Future of Privacy-Preserving AI in a Decentralized World
- KAITO (KAITO) Price Prediction 2025–2030: Deep Dive into an AI-Driven Web3 Platform
- The Next Frontier of IP: On-Chain, AI-Enhanced, and Creator-Driven
- Space and Time (SxT): Powering the Future of Verifiable Data in Web3 and AI
- What Is Balance (EPT): Exploring the Web3 Protocol with AI-Driven Companions
- PROMPT (Wayfinder): Unlocking the Future of Blockchain with AI Agents
- What Is Reploy (RAI): AI-Powered Web3 Tools & Blockchain Code Editor
- Revolutionizing Venture Capital with AI16z DAO
- TIBBIR: The Pioneering Intersection of AI and Blockchain
- AI Meets Memecoins: Profiting with GOAT’s Deflationary Power
- IMGN (IMGN Labs): The Image Generator For Every Occasion
- Deep Dive into AO: A Decentralized Open-Access Supercomputer
- Creator.Bid (BID): Revolutionizing Digital Content with AI-Powered Blockchain Innovation
- ACT Coin: Igniting the Decentralized AI Transformation
- Neurashi (NEI) Explained: AI Cryptocurrency Powered by AI
- Kaito (KAITO) Explained: AI-Driven Crypto Research & Fair Rewards
- What Is DeepSeek? How Its AI Model Influence on Crypto?
- Unlock Passive Income with Nodepay: Earn Nodecoin by Sharing Bandwidth
- KAITO: The Future of AI-Powered Research
- enqAI (ENQAI): Powering Governance, Security, and Incentives in Decentralized AI Networks
- Listen-rs (LISTEN): All You Need To Know
- Venice AI Token Airdrop: Unlocking Decentralized AI with VVV
- TRACY Token: Investing in the Future of Sports Analytics
- IP Token: How Story Tokenizes Creativity
- DeepSeek AI Price Prediction 2025-2030: Future of DEEPSEEK
- Battling Misinformation of AI: OriginTrail and Decentralized Knowledge
- LUMO Cryptocurrency: LUMO Labs and LUMO-8B-Instruct
- Shaping Healthcare's Future: AxonDAO and AXGT
- IFSci Token: Revolutionizing AI & Scientific Research
- VVV Token: Venice AI Taking Privacy and Blockchain to Another Level
- Discover the Future of Cryptocurrency with SoSoValue
- A Guide on Tars AI (TAI): Is This Solana-Based Project the Future?
- TAOCAT: The AI-Driven Token Redefining Decentralized Blockchain Interactions
- PinGo: Transforming AI Access for Everyone
- Future-Proofing AI Deployment with the AIOS Framework
- VaderAI: Revolutionizing Crypto Trading with AI Agents
- Understanding Nodecoin (NC): Your Guide to AI
- What Is Ava AI? a Beginner's Guide to AVA
- ChainGPT (CGPT) Price Prediction 2025-2030: A Comprehensive Analysis
- COOKIE DAO Price Prediction 2025-2030: A Comprehensive Analysis
- The Future of Investing: Citadail's AI & Blockchain
- BUZZ Cryptocurrency: Revolutionizing DeFi with HIVE AI
- Quantum Computing Meets AI: Tsotchke's Innovations
- SUIAI Cryptocurrency: Transforming the Future of AI and Blockchain Integration
- Discover Top Hat: The Future of AI Agents in the Crypto World
- Xterio: A Deep Dive into Xterio
- Meet Privasea AI: Next-Gen Data Protection
- What Is Heurist and How to Buy HEU Token?
- VANA Price Prediction & Forecast 2025-2030
- Vana: The Future of AI Data Sovereignty and User Control
- Top 5 AI Meme Coins to Watch for 2025 Bull Run
- Grass (GRASS) Price Prediction: 2024, 2025-2030
- HealthSci_AI: Empowering Healthcare Through AI and Decentralization
- BlockMesh: Pioneering Ethical AI and Decentralised Connectivity
- Understanding the iMonster AI (IMON) Project
- VVAIFU (Dasha) Cryptocurrency: All You Need To Know
- How WienerAI Is Revolutionizing Crypto Trading with AI Technology
- How ZenQ Token is Revolutionizing AI with Decentralized Computing Power
- Exploring GRASS Token: A Deep Dive into Grass
- What Is Bittensor and How to Buy $TAO Tokens?
- Understanding Bittensor and the TAO Cryptocurrency
- What Is Image Generation AI and How to Buy IMGNAI Tokens?
- What Is Oasis Network and How to Buy ROSE Tokens?
- What Is GraphLinq Ecosystem and How to Buy GLQ Tokens?
- What Is IO.NET and How to Trade IO tokens?
- What Is Aethir’s ATH and How to Trade ATH?
- Render Token (RNDR): What Is It and How to Earn?
- What Is OriginTrail and How to Buy TRAC?
- What Is Cere Network and How to Buy CERE?
- What Is Alethea AI Blockchain and How to Buy ALI Tokens?
- What Is FORTA Network and How to Buy FORT Coins?
- What Is Akash Network and How to Buy AKT?
- What Is LayerAI and How to Buy LAI?
- What Is Cortex Labs and How to Buy CTXC Tokens?
- What Is OctaSpace and How to Buy OCTA Coins?
- Sahara Decentralized AI Blockchain: Shaping an Open, Equitable, and Collaborative Global Economy
- Is Qubic a Game-changing PoW L1 Project in the Market?
- Top 10 AI Crypto Projects in 2024 and How to Buy Those Tokens
- What Is Ultiverse and How to Buy ULTI Token?
- How IO.NET Is Revolutionizing AI with Decentralized Computing Power and Cutting Costs by 90%
- What Is Masa and How to Buy MASA?
- What Is OpSec (OPSEC)?
- AIUS Coin: The Future of Decentralized AI Solutions
- What Is QnA3.AI (GPT) Token?
- What Is Clore.ai and How to Buy CLORE Tokens?
- What Is ChainGPT and How to Buy CGPT Tokens?
- What Is Streamr and How to Buy DATA Tokens?
- What Is Graph Network and How to Buy GRT?
- Offering Free BTRST for Talent Referral, How Braintrust Overtakes Traditional Recruitment Platforms?
-
- MEME
- Mog Coin Price Prediction: Is MOG Headed for a Breakout or Breakdown?
- BONK (BONK) Price Prediction 2025, 2026-2030
- What Is PPKAS? Discover the Meme Token Revolution on the Kaspa Network
- Baby Doge Coin (BABYDOGE) Price Prediction 2025, 2026-2030 Will the Meme Coin Make a Comeback, or Fade Further?
- KREX (KREX) Price Prediction 2025, 2026-2030
- Fartcoin: The Unique Meme With “Fart” Transaction Sounds
- SHIC Explained: A Community-Crafted Meme Coin You Can Actually Mine
- What Is Gorbagana (GOR): From Meme Coin to Devnet Powerhouse on Solana
- Pengu: Uniting the Pudgy Penguins Community
- MEW (cat in a dogs world) Price Prediction 2025, 2026-2030
- BUILDon (B) : Driving USD1 Use Case and Liquidity Growth on BNB Chain
- Moo Deng (MOODENG) Price Prediction 2025, 2026-2030
- $USELESS: The Meme Coin That Proudly Does Nothing in the $Bonk Ecosystem
- Introduction to Noot Noot: From Children’s TV to Internet Phenomeno
- Abster (ABSTER): The Evolution of a Meme Coin with Big Ambitions
- JAGER: Meme Coin, Decentralized Governance, and Blockchain Transparency
- What Is SuperFriend (SUPFRIEND): Guide to the AI Meme Coin on Solana
- Birth of LEMON and Its Impact on the Meme Coin Landscape
- Meme Culture Meets Conservation: Discover Sudeng on Sui
- Paws (PAWS) Price Prediction 2025, 2026–2030
- Sign Protocol: The Future of blockchain-agnostic Attestation
- MemeFi Unleashed: Meme Culture and Crypto Create the Future of Web3 Fun
- What Is Hosico: Your Guide to the Cat-Themed Meme Coin Hype
- What Is BUCKAZOIDS: The Meme Token Inspired by a 1991 Video Game
- Popcat (POPCAT) Price Prediction 2025, 2026-2030
- What Is Memecoin Token: The Solana Meme Coin Celebrating Pepe’s Legacy
- Housecoin on Solana: Hedging the American Housing Bubble
- Retard Finder Coin (RFC) Price Prediction 2025, 2026-2030
- Retard Finder Coin (RFC): The Rise of a Community-Driven Meme Coin on Solana
- Blending Crypto and Compassion: The Story of FRED
- What Is FAT NIGGA SEASON (FAT): The Community-Driven Token Shaking up Solana
- Ghiblification: AI Anime Image Trend Inspired Solana Meme Coin
- SZN: Memecoin Influenced by Justin Sun
- Tutorial (TUT): Revolutionizing AI Crypto Education & Meme Culture
- Mubarakah (MUBARAKAH): BNB Chain Memecoin Fever
- Deep Dive into MUBARAK: Memecoin from Four Meme Launchpad
- Turbo: Shaping the Future of Crypto with AI and Fairness
- Exploring DRB : The First Memecoin Created by Grok
- Exploring GrokCoin: An AI-Driven Memecoin
- PNUT Coin: The Squirrel That Sparked a Crypto Revolution
- FROC Crypto: Is This Meme Coin the Next Big Breakout?
- Bull Coin: Meme Token Overview & Crypto Market Risks
- MEW Coin: The Cat That’s Conquering Crypto
- Mog Coin: The Cultural Revolution in Memecoins
- SIREN Token: A Comprehensive Guide to the BNB Chain Meme Coin
- PAIN Crypto: The Meme Coin Turning Internet Culture into a Community-Driven Movement
- HULEZHI Token: A Meme Coin with a Powerful Narrative
- ANDYBSC: Playful Meme Token on BSC
- What Is $LIBRA: Argentina President Javier Milei’s Crypto Endorsement, Rise, Fall, and Scandal Explained
- GROK: The Hype, Risks, and Tokenomics Explained
- DOGE vs. $TRUMP: Which Will Be the King of Memecoin?
- BROCCOLIF3B: The First Broccoli on Chain & Four.meme
- Simon's Cat Price Prediction 2025-2030: Can CAT Reach $0.0076?
- Beyond the Hype: Investigating 3 BNB Chain Meme Coins
- Animecoin Price Prediction 2025-2030: Will ANIME Surge?
- GoFundMeme Coin: The Token That’s Revolutionizing Meme Coin Creation
- Berachain: What Is Proof of Liquidity?
- PAIN: Is This Meme Coin the next Big Crypto Sensation?
- JAILSTOOL Cryptocurrency: What You Need to Know About This New Meme Coin
- BLACKDRAGON: The near Protocol Memecoin for Education & Fun
- CAR Meme Coin: The Central African Republic's Entry into Cryptocurrency
- Henlo (HENLO): Redefining Meme Coins in the Berachain Ecosystem
- The Journey of CaliCoin: A Unique Cyborg Memecoin
- STONKS Token: The Meme Coin Shaking up Crypto Markets
- Unlocking JellyJelly: Your Guide to Solana's Meme Coin
- Explore StupidCoin: The Memecoin on Solana
- PASTERNAK MEME COIN: First Ever Meme Coin on Clout
- Animecoin: Empowering Fans Through Community Ownership
- VINE Token: How a Viral App’s Legacy Sparked a Crypto Boom
- AI Tokens Surge as Trump Unveils $500B Stargate Initiative
- LOFI on Sui Network: Should You Invest in This New Memecoin?
- Introducing American Coin and How to Buy
- Understanding 1DOLLAR and How to Buy
- A Complete Guide to Aimonica Brands (AIMONICA)—All You Need to Know
- Token MOMO: The Memecoin Empowering Privacy, Freedom, and Fun on Solana
- Explore Toshi: The Memecoin Transforming the Base Blockchain
- What Exactly Is Rocky (ROCKY) Memecoin?
- DEGEN Price Prediction: Forecast 2025 to 2030
- Exploring Baby Shark Meme (BABYSHARK): Why It Matters
- Ai16z Inspired Crypto Guide: What Is LLM (Large Language Model) Crypto?
- The Rise of Meme Coins on the Hyperliquid Chain
- EVAN Cryptocurrency: The Ultimate Guide to the Guardian of Degens
- Kekius Maximus (KEKIUS) Price Predictions 2025-2030
- Exploring KROAK: A Deep Dive into the Frog-Meme Coin on Kaspa
- Introducing COCO: The New Meme Coin Making Waves
- Elon Musk's Meme Magic: The Rise of Kekius Maximus in the Crypto World
- Discovering Kekius Maximus: The ETH Meme Coin
- Crypto All-Stars ($STARS) Price Prediction 2025-2030: A Comprehensive Analysis
- Why Invest in Ripple Meme Coin? Here's Why You Should
- Unlock Your Potential with RAT: Memecoin for Everyone
- Pudgy Penguins (PENGU) Price Prediction 2025-2030
- Maximize Your Memecoin Trading Experience with Hypurr Fun
- The Comprehensive Ecosystem of Orbit: Redefining DeFi with Blockchain
- Top 5 Elon Musk Crypto Coins to Look Out For in 2025
- SATS: A Milestone in Bitcoin's Token Ecosystem
- Understanding HoldCoin: Revolutionizing Crypto Management
- XRP Memecoins Are Heating Up—What’s Behind the Hype and How Long Will It Last?
- Why MONKY Stands Out: The Future of Memecoins
- What Makes RATS so Popular and How to Buy on CoinEx?
- Exploring Pepecoin: How It Aims to Foster a New Community Culture in Crypto
- Bitcoin’s First-Ever Token: How ORDI Is Transforming the Blockchain and Skyrocketing in Value
- Catana (CATANA): A Rising Star in the Memecoin Universe
- ARMY Token’s Market Trends: A Deep Dive into XRPL’s Meme Coin Phenomenon
- AI Memecoins: Tracking the Rise of a New Crypto Category in 2024
- Understanding Junkcoin (JKC): A Comprehensive Guide to the Memecoin Phenomenon
- Exploring LKY: A Deep Dive into Luckycoin
- Pump.Science and Web3 Developments in the Science Space
- Meet Chill Guy: The Meme Character Who Represents a Lowkey Lifestyle in Crypto
- Top Meme Coins to Buy at the End of 2024
- What is DeSci? A Comprehensive Guide to Decentralized Science
- The Future of Multi-Chain Tokens: Why Base Dawgz is Leading the Pack
- Understanding the “Elon Musk Meme” Trend: What You Need to Know
- Exploring RIFSOL: A Deep Dive into Rifampicin
- Rising Cryptocurrencies Inspired by Elon Musk
- From Game to Blockchain: The Fascinating Journey of Bellscoin
- Top 5 Meme Coins 2024: Best Picks for Bull Run Gains
- Understanding FRED: The Meme Coin That Represents the Struggle for Animal Justice
- What’s the Story Behind the Rise of the Meme-Backed Pepecoin?
- Understanding PNUT: How Peanut the Squirrel's Story Influences the Meme Token Market
- KEKE Cryptocurrency: The All New Meme King on Kaspa
- The Future of LUCE: Insights into Solana's Trending Meme Token
- Introducing BANSOL: The Artwork Inspired Meme Coin
- Exploring KONAN: A Deep Dive into Konan of Kaspa
- Exploring Cult Meme Coins: SPX6900 (SPX) and the Rise of Community Culture in Cryptocurrency
- What Is Daddy Tate Coin and How to Buy DADDY?
- Top 5 Meme Coins You Need to Know
- Omochi Cryptocurrency: All You Need To Know
- Sealana's Hunt for the Next Big Solana Meme Coin: A Trader's Obsession
- Pepe Unchained Presale: A Smart Crypto Move?
- The Rise of BLUB: How It Fits into the Future of Meme Coins
- Exploring PUFFY Token: A Deep Dive into Puffy
- HAMMY Crypto: All You Need To Know About The Sad Hamster
- How DOGEGOV Combines Meme Culture with Political Reform
- Exploring MSTR Token: A Deep Dive into the Most Crypto Enthusiast Stock
- What Is MOODENG? All About the Baby Hippo Memecoin on Solana
- KASPY: The Heartfelt Story of a Three-Legged Cat
- Exploring NACHO: The Meme Token Driving Innovation in the KRC20 Ecology
- The Memecoin Supercycle: How Memecoins Could Lead the Next Crypto Bull Market
- How Meme Culture Drives the Popularity of SIGMA in the Cryptocurrency Market
- Introducing Moo Deng: A Viral Solana-Based Meme Coin
- Exploring SKBDI: A Deep Dive into Skibidi Toilet
- Exploring HIPPO Sudeng: A Deep Dive into the Meme Coin on SUI
- Why Cutoshi is the Luckiest Meme Coin
- Exploring MARS: A Deep Dive into the Cryptocurrency for Martian Colonization
- What Is Malone Lam Meme Token (MALONE) & Why Is It so Popular?
- Pesto: Revolutionizing Community Engagement with the PESTO Token
- The Rise of TikTok's Viral Animal-Themed Memecoins: $MOODENG, $OMOCHI, and $PESTO
- What Is Guacamole and How to Buy GUAC Tokens?
- What Is DooDoo and How to Buy DooDoo Tokens?
- What Is Smolecoin and How to Buy SMOLE?
- What Is Beercoin and How to Buy BEER Tokens?
- What Is BOBO and How to Trade BOBO Tokens?
- What Is Fud the Pug and How to Trade FUD Tokens?
- What Is Gigachad (GIGA) and How to Trade GIGA?
- Pepe Coin (PEPE) Price Prediction: 2024, 2025-2030
- What Is PONKE and How to Trade PONKE Tokens?
- What Is Base God and How to Trade TYBG Tokens?
- TURBO: The GPT-4 Memecoin
- What Is Milady Meme Coin and How to Buy LADYS Coins?
- What Is Wojak and How to Buy Wojak Coins?
- What Is Refund Coin and How to Buy RFD Coins?
- A Beginners Guide to PawZone and How to Buy PAW in 2023
- What Is SNEK Meme Token and How to Buy?
- Tron Bull: A Deep Dive into the Meme Coin Turning Heads in 2024
- Exploring DMTC: A Deep Dive into Diamond the Cat Coin
- Exploring FISH: A Deep Dive into TON FISH MEMECOIN
- The Bipolar Elephant: Introduction to the Meme Coin WHY
- AVAIL: A Comprehensive Guide to the Revolutionary Polygon Blockchain Project
- Exploring BILL Coin: A Deep Dive into the BILL Token Project
- Solana Meme Coins on the Rise - Here Are the 3 Newest Arrivals You Need to Know About
- RETARDIO: A Bold New Player in the Solana Blockchain
- Memechan ($CHAN): Meme Coin on the Solana blockchain
- Andrew Tate’s DADDY Token Skyrockets 200% in One Day, Surpassing MOTHER Token’s Market Cap
- What Is Mother Iggy and How to Buy MOTHER?
- MOTHER Solana's Meme Coin On A Bull Run Despite Rocky Initial Launch
- Can ANDY Become the Next Big Memecoin in the Market After PEPE?
- What Are the Top 5 Potential Memecoins for 2024 and How to Buy Them?
- GME Coin: Solana Meme Coin Pumps Over 400% In Under A Day
- What Is Silly Dragon and How to Buy SILLY Coins?
- What Is GROK and How to Buy GROK Tokens?
- What Is Degen and How to Buy Degen Tokens?
- What Is Based Brett and How to Buy BRETT Tokens?
- An Introduction of BOOK OF MEME ($BOME)
- Blockchain Meets Meme Culture: Inside the Innovative World of BOOK OF MEME (BOME)
- Demystifying NORMIE Cryptocurrency: Facts and Insights
- Decoding the DEGEN on Base Chain Meme Coins
- A Brief History and Background of Smolecoin (SMOLE)
- All About the MUMU Meme Coin and Its Popularity
- A Brief Introduction to the IQ50 Meme Coin and Its Popularity
- BOME Becomes the New MEME Myth of Solana, Rockets Over 1700% in 3 Hours
- What Is Frencoin and How to Buy FREN Coins?
- What Is Decentraland Virtual World and How to Buy MANA Tokens?
- What Is Memeland and How to Buy MEME Tokens?
- What Is Banano Crypto and How to Buy BAN Tokens?
- What Is MONG and Where to Buy MONG Coins?
- What Makes Controversial Meme Coins Appealing?
- What Is BOB Meme and How to Buy BOB?
- What Is Floki Inu and How to Buy FLOKI?
- Made Popular by Shib, the Meme Tokens You Must Know
-
- Cat Meme
- PAJAMAS Token: The First YouTube Cat Crypto on Solana
- Top 10 Cat Meme Coins to Buy in 2025
- The Impact of HAPPY (Happy Cat) on the Solana Blockchain Ecosystem
- Introducing the Meme Initiative aaaCat on Sui
- Maine Coon Cat: The next Big Thing in the Crypto Space
- What Is SUNCAT and How to Trade SUNCAT?
- What Is MAO and How to Trade MAO Tokens?
- How to Get Catizen ($CATI) Tokens?
- Introducing Giko Cat: The Solana Cat Meme
- What is Catizen (CATI): Revolutionizing Web3 Gaming and Blockchain
- CATS Cryptocurrency Overview: All You Need to Know
- What Is Toshi and How to Buy TOSHI Tokens?
- What Is POPCAT and How to Buy POPCAT Tokens?
- Simon’s Cat – an In-Depth Exploration of the Ecosystem
- Top 5 Potential Cat-Themed Meme Coins for the Second Half of 2025
- What Is Cat in a Dog's World and How to Buy MEW?
- The Cat that Brings Fortune to Crypto Investors
- What Is WEN and How to Buy $WEN Tokens?
- What Is MOG Coin and How to Trade MOG?
- Decrypting MEW: the Cat-themed MEME Coin
- What Is Huhu Cat (HUHU)?
-
- Dog Meme
- Cocoro Coin: The New DOGE? Official Meme Coin Revolutionizing the Crypto Market
- Power of Community: WIF Coin’s Meteoric Rise
- FLOKI: From Viral Meme to Crypto Legacy
- PERRY Meme Coin: The Meme Coin Inspired by CZ’s Dog
- BROCCOLI Token (CZ'S DOG): The Viral Memecoin Taking Over
- Shiba Inu (SHIB) Price Prediction 2025, 2026-2030
- Bonk: Solana’s Meme Revolution with Real-World Impact
- Dogecoin vs Shiba Inu: Key Differences & Which is Better?
- Introducing the Meme Real Dog on Base: SKI
- Meet Dogi: The DRC-20 Token Revolutionizing Dogecoin
- 4 Dog Memes with Highest Performance 2024 and Performance Predictions for 2025
- Exploring Hot Token: A Deep Dive into D.O.G.E on Solana
- Neiro ETH_ The Next Chapter in the Dogecoin Legacy
- Exploring Dogecoin: The Memecoin That Took Over Crypto
- DOGS (DOGS) Price Prediction 2024, 2025-2030
- What Is Welshcorgicoin and How to Buy WELSH Tokens?
- What Is DUKO and How to Buy DUKO Tokens?
- What Is Dogecoin (DOGE): History, When it Launch, and Market Performance
- What Is BenDog and BENDOG Token?
- Dogecoin (DOGE) Price Prediction 2024-2030: Future Forecast
- What Is DOGS Coin on TON, and How to Buy DOGS?
- Dogecoin vs Bitcoin: Differences You Must Know
- What Is Shiba Inu and How to Buy SHIB?
- DOGS: A Deep Dive into the New Meme Coin on TON
- DOGS: The TON memecoin that promises to surpass Hamster Kombat
- Exploring SUNDOG: A Deep Dive into Sun Dog
- Wrapped Dog (WDOG): A Comprehensive Overview of the Solana-Based Meme Token
- Exploring NEIROETH: A Deep Dive into NEIRO
- Exploring SelfieDogCoin: The Meme Token on Solana’s Blockchain
- New Solana Memecoin "NEIRO" Captures Investors' Attention
- Billy Coin (BILLY): From Internet Meme to Market Sensation
- How Shiba Inu Would Benefit from the Shibarium Bridge Upgrade
- Top 5 Potential Dog-Themed Meme Coins in 2025
- What Is DOG Memecoin and How It Became a Popular BTC Rune Among Holders?
- What Is MYRO (MYRO) Token?
- What Is BONK and How to Buy BONK Tokens?
- What Is Arb-Doge AI and How to Trade AIDOGE Tokens?
- What Is Cheems Meme and How to Buy Cheems?
- What Is Dogelon Mars and How to Buy ELON?
- What Is Baby Dogecoin (Baby Doge)?
- What Is Kishu Inu and How to Buy KISHU?
- What Is Dogecoin?
- How Did SHIB, a Copycat Coin, Grow by 50 Million Times?
- Coinbase Misses the Golden Opportunity to List Dogecoin Which Skyrocketed More than 400-fold A Year
- Political Meme
- Exploring the Future Viability of Trump’s Meme Coin
- Exploring Pwease: A Deep Dive into PWEASE Political Meme Coin
- Trump-Inspired Meme Coins: The Frenzy and the Fallout
- $BARRON: The Meme Coin Inspired by Barron Trump’s Internet Mystique
- Official Barron Meme (BARRON) Price Prediction 2025, 2026-2030
- Melania Meme (MELANIA) Price Prediction 2025, 2026-2030
- Official Trump (TRUMP) Price Prediction 2025, 2026-2030
- All You Need to Know About Melania Trump Crypto Coin $MELANIA
- Is TRUMP the Official Trump Memecoin? Breaking down the Hype
- Donald Trump Launches Official Trump Coin: Exploring the Rise of Trump Memes
- Top PolitiFi Cryptocurrencies to Invest in 2024-2025: A Comprehensive Guide
- Decoding the Hype: Trump-Themed Memecoin Ahead of the US Election
- What Is TREMP and How to Buy TREMP Tokens?
- What Is $MAGA and How to Buy?
- Top 10 PolitiFi Projects In 2024 and How to Buy Their Tokens
- Meme Coins in the Election Spotlight: A Look at Trump's MAGA and Harris Tokens Ahead of the Debate
- Trump on the Bitcoin Conference: What It Means for $MAGATRUMP Token
- FEARNOT: From Trump's Slogan to a Cryptocurrency Phenomenon
- FIGHT TO MAGA: Exploring the Trump-Inspired Meme Coin
- TrumpCoin(DJT)'s Volatile Price: Who's the Man Behind?
- MAGA Cryptocurrency: All Need to Know
- TRUMP Memecoin Makes Waves in the Market — Is It Going to Be the Next Big Hit After PEPE?
- Why Did TREMP Surge 53% in Just a Week?
- What Is MAGATRUMP (MAGA) Coin?
-
- Cosmos
- Initia (INIT) Price Prediction 2025, 2026-2030
- Deep Dive into MilkyWay: The Future of Modular Liquid Staking
- Berachain: A Comprehensive Guide to Its Tokenomics and Ecosystem
- What Is ZetaChain and How to Buy ZETA?
- What Are THORSwap and THOR Coins?
- What Is Osmosis and How to Buy OSMO?
- What Is the Stride and How to Buy STRD?
- What Is Cosmos Network and How to Buy ATOM Tokens?
- What Is Sei Network and How to Buy SEI Tokens?
- What Is Kava Blockchain and How to Buy KAVA Tokens?
- What Is Terra and How to Buy LUNA?
- Stablecoin
- What Is the Stablechain for USDT? Your Guide to Tether Blockchain Ecosystem
- What Is StablR Euro (EURR): The Ultimate Guide to Euro-Backed Blockchain Transactions
- Resolv (RESOLV) Price Predictions 2025, 2026-2030
- Why USD1 Stablecoin Is Gaining Ground in Crypto 2025?
- The Next Chapter of USDT: Tether’s Strategic Development in 2025
-
- Solana
- AURA (Aura Coin) Price Predictions 2025, 2026-2030
- GALA (Gala Games) Price Prediction 2025–2030
- COLLAT: Transforming Real-World Asset Tokenization on Solana
- DUPE: Transforming Affordable Shopping with Web3-Powered Marketplace
- $MIKAMI: Exploring the Hype, Opportunities, and Risks of This Solana Meme Coin
- What Is Metadrip: The Ultimate AI-Driven DeFi Platform on Solana
- Deep Dive into TROLL: Riding the Meme Wave
- Aergo (AERGO) Price Prediction 2025, 2026-2030
- HYPE vs. JUP: Key Differences and Which One to Invest In?
- InfiniSVM: The Future of Solana Scaling by Solayer
- Enhancing Social Connections with Tapestry on Solana
- Solana's Leap: Insights Into Blockchain's Next Giant
- Solana (SOL) Price Prediction 2024, 2025-2030
- What Is SLND?
- What Is Raydium and How to Buy RAY?
- What Is Kin and How to Buy Kin Tokens?
- What Is Marinade.Finance and How to Buy MNDE Tokens?
- ORE Cryptocurrency: All You Need To Know
- Breaking Down Zeus Network - a Project Backed by Co-founders of Solana and Stacks
- CROWN: How This Solana-Based Token Powers Third Time's Virtual?
- WHALES: Understanding Whales Market's Native Currency
- Rising New Star: TNSR
- What Is Solana and How to Buy SOL?
- What Is Basic Attention Token and How to Buy BAT?
-
- ZK
- Polyhedra Network (ZKJ) Price Prediction 2025-2030
- What Is Nillion Crypto: Should You Buy This Token Featuring Blind Computing?
- Scaling Ethereum with Innovation: Linea’s Native Token Set to Launch in Q1 2025
- Zircuit (ZRC) Cryptocurrency Goes Live on CoinEx: Here’s How to Invest Wisely
- Zircuit (ZRC) Overview: A Comprehensive Guide
- Unlocking Data Privacy: Exploring NuLink, the Web3-Based ZK Provable Solution for DApps
- What Is Nulink and How to Buy NLK?
- What Is ZKsync and How to Trade ZK Tokens?
- What Is Holdstation and How to Trade HOLD Tokens?
- Understanding Aleo: The Future of Cryptographically Secure dApps
- ZKsync Tokens: Ethereum Layer-2 Scaling Solution Airdrop
- RAIL Cryptocurrency: The Vitalik Endorsed Privacy Protocol
- What Is Loopring and How to Buy LRC?
- An Introduction to Mina Protocol: Understanding the Basics
-
- Smart Contract Platform
- What Is CAMP (CAMP): A Comprehensive Guide to Camp Network
- Dolomite (DOLO) Crypto Price Prediction 2025, 2026-2030
- Numerai (NMR) Crypto Price Prediction 2025, 2026-2030
- What Is Bitlayer (BTR): The First Bitcoin Layer 2 for Secure and Scalable DeFi
- Bio Protocol Price Prediction 2025, 2026-2030
- What Is SAPIEN (Sapien): A Guide to the Decentralized AI Data Token
- What Is INFINIT (IN) Token? Unlocking Governance, Staking, and DeFi Opportunities
- Mamo (MAMO) Price Prediction: Will AI-Powered Blockchain Agents Define the Next Web3 Cycle?
- What Is Ika (IKA)? Exploring the Fastest MPC Network on Sui Blockchain
- What is Quantoz EURQ? Exploring the Digital Euro Stablecoin Revolution
- SPK Ignites DeFi Lending: A Deep Dive into Spark Protocol’s Powerhouse Token
- ICP (Internet Computer) Price Prediction 2025–2030
- Huma Finance (HUMA) Price Prediction 2025, 2026-2030
- Casper Network (CSPR) Price Prediction 2025, 2026-2030
- What Is Xahau (XAH): The Smart Contract Revolution on the XRP Ledger
- FXN Analysis Report: Exploring the Rising Star in Blockchain
- Story Protocol and Its Impact on Intellectual Property Management
- SUI (SUI) Price Prediction 2025, 2026-2030
- Stellar (XLM) Price Prediction 2025, 2026-2030
- TRON (TRX) Price Prediction 2025, 2026-2030
- Cardano (ADA) Price Prediction 2025, 2026-2030
- Hedera Hashgraph (HBAR) Price Prediction 2025, 2026-2030
- Fantom (FTM) Price Prediction 2025-2030: Comprehensive Insight
- Troy (TROY) Price Prediction: A Comprehensive Analysis for 2025-2030
- What Is TRIAS and How to Trade $TRIAS Tokens?
- From Decentralized Oracles to Smart Contracts: The Evolution of Chainlink
- Exploring Cardano: The Future of Smart Contracts
- Explore the Value of CET and the New Trend of Platform Token Development
- What Is Neo and How to Buy NEO?
- What Is Ultra and Where to Buy UOS Tokens?
- What Is Chia Network and How to Buy XCH?
- What Is Reef Chain and How to Buy REEF?
- What Is MultiversX and How to Buy EGLD Tokens?
- Monad: The Developer-Forwarded Layer1 Smart Contract Platform Optimizing Blockchain Productivity
- The Origin and Development of CET: Past, Present, and Future
- Exploration of the CET Tokenomics and CoinEx Ecosystem Development
- What Is CET: Learn More about the Cryptocurrency CET
- What Is Klaytn (KLAY)?
- Recent Surge in CoinEx Token CET: An Analysis of Its Future Development Potential
- What Is Tezos and How to Buy XTZ Tokens?
- What Is XDC Network and How to Buy XDC?
- What Is VeChainThor and How to Buy VET Tokens?
- What Is Algorand and How to Buy ALGO Tokens?
- What Is Near Protocol and How to Buy NEAR Tokens?
- What Is Hedera and How to Buy HBAR Tokens?
- What Is Conflux Network and How to Buy CFX Coins?
- What Is Polkadot and How to Buy DOT?
- What Is Algorand Blockchain and How to Buy ALGO?
- What Is Internet Computer and How to Buy ICP?
- What Is Bitgert and How to Buy BRISE?
- What Is EOS and How to Buy EOS?
- What Is Kusama (KSM) and How to Buy?
- What Is Polkadot Blockchain?
- What Is Flare Network?
- An Undervalued New Public Chain: How NEAR Defied the Gloomy Market and Reached New Highs
-
- Layer 2
- Neon EVM Price Prediction 2025, 2026-2030
- ZORA Rockets 50% in 24 Hours: What’s Behind the Creator-Coin Craze?
- Eclipse Network: Ethereum’s Security Meets Solana’s Speed
- GMX (GMX) Price Prediction 2025–2030
- Mantle (MNT) Price Prediction 2025, 2026-2030
- BLOCK (BLOCK) Price Prediction 2025, 2026-2030 Will BlockProtocol Rebound After a 99% Drop?
- Polygon (POL) Price Prediction 2025, 2026-2030
- XTM: Unlocking the Digital Asset Economy with Tari
- AAVE (Aave) Price Prediction 2025–2030 Can the DeFi Lending Giant Reclaim Its All-Time High?
- AERO (Aerodrome Finance) Price Prediction 2025–2030: Can the DeFi Hub of Base Take Flight?
- What Is Lagrange (LA)? Powering Infinite ZK Scalability & Verifiable Computation
- Stacks (STX) Price Prediction 2025–2030: Can Bitcoin’s Smalisrt Contract Layer Deliver Long-Term Growth?
- Sophon Explained: Gasless Entertainment Layer 2 Powered by SOPH Token
- What Is SOON? Exploring the Super Adoption Stack for Blockchain Scalability
- WCT: The Infrastructure Token Powering Web3 Connectivity
- What Is Shardeum (SHM): The EVM-Based Autoscaling Blockchain
- What Is Evernode (EVR): A Layer-2 Network on XRP Tailored to Hosting dApps
- Exploring the SOON Network: A New Era for Layer 2 Solutions
- Exploring Unichain: A Deep Dive into the DeFi-Native Superchain
- Introducing the First Real-Time Blockchain: MegaETH
- Zulu Network: Pioneering the Future of Bitcoin Layer 2 Solutions
- How Lumoz (MOZ Token) Leads the AI & Crypto Market
- OBT: Pioneering Cross-Rollup Efficiency in the Ethereum Ecosystem
- Breaking down DuckChain (DUCK): A Thorough Guide to This Hot Project
- Base: Revolutionizing Ethereum with a Scalable Layer 2 Solution
- Exploring Fuel Network: A Deep Dive into FUEL Token
- Is MOVE the Hidden Gem of Layer-2 Solutions?
- Exploring Boba Network: A Multichain Layer 2 Solution
- Reddio: Zero-Knowledge Technology Impact on Ethereum Layer 2
- What Is AltLayer and How to Buy ALT Tokens?
- What Is MERL Chain and How to Buy MERL Token?
- What Is PacMoon PAC Cryptocurrency?
- What Is LayerZero and How to Trade ZRO?
- What Is Mode Network and How to Trade MODE Tokens?
- Understanding Starknet (STRK): How Does it Change Ethereum Transactions?
- Top 10 Layer-2 Crypto Projects in 2024 and How to Buy Their Tokens
- Optopia (OPAI): Revolutionizing Web3 with AI-Driven Layer 2 Network
- 3 Lending & Borrowing Projects on Blast Ecosystem You Can’t Miss
- Exploring the Blast Ecosystem: A Guide to Purchasing on CoinEx
- LayerZero (ZRO) : Pioneering Omnichain Interoperability
- Unveiling MERL Token: Transforming Bitcoin with Layer 2 Innovation and Zero-Knowledge Proofs
- What Is Rocket Pool and How to Buy RPL Tokens?
- What Is Optimism and How to Buy OP Tokens?
- What Is Arbitrum and How to Buy ARB Coins?
-
- GameFi
- Somnia (SOMI) Price Prediction 2025, 2026–2030
- Brilliant Crypto Token (BRIL) Price Prediction 2025, 2026-2030
- Bombie (BOMB) Price Prediction 2025-2030: Will BOMB Explode?
- Elderglade: Forging a Fantasy Frontier in Web3 Gaming
- Tokyo Games Token (TGT): Redefining Gaming, Governance, and Lifestyle in Crypto
- What is NEXPACE? The Web3 Gaming Token Powering MapleStory Universe
- SIGN Crypto Price & Trends: Why It’s Gaining Momentum
- The Future of Crypto Gaming in 2025; All You Need To Know!
- Top Memecoins on the Base Network to Watch in 2025
- Exploring Voxie Tactics: Play-to-Earn and VOXEL Token
- What Is $Fun Token: Revolutionizing Decentralized Finance and Gaming by Providing an Adequate Platform
- What Is GUNZ (GUN): The Utility Token Behind the First AAA Web3 Game, off the Grid
- Exploring Open Loot: The Future of Web3 Gaming and NFT Integration
- Sonic SVM Mobius Mainnet Launch: A New Era for GameFi
- B3.fun Cryptocurrency: The Future of Onchain Gaming
- The YULI Token: Revolutionizing SocialFi and Location-Based Gaming
- Revolutionize Your Game Development with Digimon
- MLG Token: Empowering the MLGEdit Ecosystem
- SONIC SVM Price Prediction 2025-2030: Future Insights
- Web3 Game Changer - Seraph: What You Need to Know About This Game
- The Gaming Evolution: Xterio TGE Is Here - What You Need to Know
- Unlock Sovereign Game Economies with Sonic on Solana
- TON Station (MRSOON): Blockchain Gaming in the Most Accessible Way Yet
- From Infrastructure to Marketplace: Why Open Loot Is the Go-to Platform for Web3 Games
- Telegram's Gaming Revolution: How MAJOR Integrates TON to Reward and Engage Players
- Exploring X Empire: A Deep Dive into the next Big Play-to-Earn Game
- What Is Nakamoto Games and How to Buy $NAKA Tokens?
- Top Tap to Earn (T2E) Crypto Games and Tokens of 2024
- Blum Crypto: What is it and How It’s Changing Telegram Gaming
- Hamster Kombat (HMSTR) Price Prediction 2024-2030
- What Is BadMad Robot ($METAL)?
- What Is Heroes of Mavia and How to Buy MAVIA Tokens?
- What Is JetTon Games and How to Buy JETTON Tokens?
- What Is GamerCoin and How to Trade GHX?
- Top 10 Play-to-Earn Games for Crypto Earnings in 2024
- What Is Pixelverse and How to Trade PIXFI?
- What Is BLOCKLORS and How to Trade LRDS?
- Hamster Kombat: What It Is, How It Works, and How to Earn Money
- What Is Matr1x and How to Buy MAX Tokens?
- What Is DeFi Kingdoms (JEWEL)?
- What Is IguVerse (IGU)?
- What Is Myria and How to Buy Myria Tokens?
- What Is HELLO Labs and How to Buy HELLO Tokens?
- What Is Echelon Prime GameFi and How to Buy PRIME Tokens?
- What Is Combo Network and How to Buy COMBO Tokens?
- What Is Axie Infinity and How to Buy AXS Tokens?
- Matr1x: The Rising New Web3 Project
- What Is Neiro and How to Trade NEIRO Tokens?
- Exploring LUMBER Token: A Deep Dive into LumberJack
- Popular Game "Pixelverse" Announces Airdrop of Its PIXFI: Here's a Project Breakdown
- Understanding the Blast Ecosystem: GameFi Innovations
- Exploring SKYA Coin: A Deep Dive into Sekuya Multiverse
- About Unagi (UNA) Cryptocurrency
- What Is XAI and How to Buy XAI Tokens?
- Top 10 GameFi: Most Popular Blockchain Games of 2024
- What Is Flow and How to Buy Flow Tokens?
- What Is Immutable X and How to Buy IMX Tokens?
- What Is Sidus Heroes Game and How to Buy SIDUS Tokens?
- What Is Treasure and How to Buy MAGIC Tokens?
- What Is Gala Games and How to Buy GALA?
- What Is Enjin Coin and How to Buy ENJ?
- What Is Alien Worlds and How to Buy TLM?
- What Is NFT Worlds and How to Buy WRLD Tokens?
- Smooth Love Potion: What Makes SLP Unique?
- League of Kingdoms, a 4X Strategy Game with Blockchain Elements
- Getting Started to Know Yield Guild Games
- CryptoBlades on a Sudden Rise, What is the NFT Game Token Skill?
-
- SocialFi
- Port3 Network’s Recent Price Rise Unveiled: Secrets Behind Its Market Momentum
- Redacted: Building the Entertainment Datasphere of Web3
- The Engine Behind The Recent Price Surge in Kaito: InfoFi
- What Is PAWS Token: How Chatting on Social Media Earns You Tokens in 2025
- Humanity Protocol: Revolutionizing Digital Identity Verification
- SyncVault: Revolutionizing Digital Journeys for Creators with Web3 Technology
- What Is DECHAT and DECHAT Token?
- Top 10 SocialFi Crypto Projects of 2024 and How to Buy Their Tokens
- What Is Decentralized Social and Where to Buy DeSo?
- Blast Ecosystem: Discovering the SocialFi Project
- What Is Solchat and How to Buy CHAT Tokens?
- What Is Republik (RPK)?
- What Is CyberConnect and How to Buy Cyber Tokens?
- What Is Open Campus and How to Buy EDU Coins?
- What Is Mask Network and How to Buy Mask Tokens?
- What Are STEPN (GMT) and GMT Tokens?
- What Is Green Satoshi Token and How to Buy GST?
-
- DeFi
- What Is BOT (BOT): The AI Trading Coin Powering Multi-DEX Execution
- What Is Mitosis (MITO): A Revolutionary Layer-1 Blockchain for Decentralized Crypto Liquidity
- Freedom Dollar (FUSD): Privacy-Focused Algorithmic Stablecoin on Zano Blockchain
- Unifi Protocol DAO (UNFI) Price Prediction 2025, 2026-2030
- Reserve Rights (RSR) Price Prediction 2025-2030
- SPK (Spark Protocol) Price Prediction 2025–2030: Can DeFi-Optimized Yield Capture Drive Long-Term Growth?
- What Is BOMB (Bombie): A Cross-Platform GameFi Experience
- KAIA (Kaia) Price Predictions 2025, 2026-2030
- HOME Token: Governance Powerhouse Fueling DeFi App
- What Is Skate (SKATE)? The Universal Application Layer for Cross-Chain dApps
- Definitive (EDGE): Institutional-Grade DeFi Trading Platform
- Avalanche (AVAX) Price Prediction 2025-2030
- MOONPIG Price Prediction 2025, 2026-2030
- CETUS (Cetus Protocol) Price Prediction 2025, 2026-2030
- From Iris Scan to DeFi Access: How Worldcoin Is Changing the Game
- Allora Network: Revolutionizing Decentralized AI for Financial Alpha
- Pi Network Price Prediction 2025, 2026-2030
- How the GENIUS Act May Send Bitcoin Price to $500K and Transform the Crypto Market
- Acala Network 2025 Updates: The DeFi Powerhouse in the Polkadot Ecosystem
- What Is Humanity Protocol? Decentralized Identity with Palm Biometrics and Zero-Knowledge Proofs
- What Is MYX Finance (MYX): Exploring the Matching Pool Mechanism for DeFi Trading
- Alpaca Finance (ALPACA) Price Prediction 2025, 2026-2030
- Coreum Blockchain: A Complete Overview of the Enterprise-Grade Layer-1 Network
- Haedal: Revolutionizing Liquid Staking on the Sui Blockchain
- What Is the SUI Ecosystem? Exploring the Future of Layer-1 Blockchain Technology
- The Launch of $QI and Quai Network’s Bold Leap into Decentralized Finance
- New Stablecoins Framework Proposed by the STABLE Act: A New Move Towards US Dollar Dominance
- Unlocking Governance: The Role of POLLEN in the Beraborrow Ecosystem
- What Is Ooga Booga: How It Enhances Berachain with Liquidity Aggregation
- Top Binance Alpha Crypto to Watch in 2025
- Bedrock (BR): Transforming DeFi with Next-Gen Blockchain Solutions
- What is Nanocard (XNO) and How Does It Work?
- Berachain’s Rapid Growth: Is It Sustainable?
- Exploring Elixir Network (ELX): A Deep Dive into Decentralized Liquidity
- Top DeFAI Tokens to Watch in 2025
- What Is DeFAI and How Does It Work?
- Shadow (SHADOW): Sonic's Liquidity Guide
- Exploring Nexus Layer 1: A Deep Dive into the Blockchain Supercomputer
- RedStone: Powering Cross-Chain DeFi with Modular Oracles
- FORTH Price Prediction 2025-2030: How High Can It Go?
- BERA vs SUI: Layer 1 Comparison and Which is Better?
- BakeryToken (BAKE): The Ultimate Guide to BakerySwap's Native Token
- Usual (USUAL) Price Prediction 2025, 2026-2030
- Unlocking Value in Monad: aPriori, MEV, and Liquid Staking
- SwissCheese (SWCH): Revolutionizing Stock Trading with Blockchain
- Wagmipad (WAGMI): A Comprehensive Guide to Berachain-Centric Token Launchpad
- Exploring Berachain’s DeFi Frontier: YEET, Overlay Protocol, Ramen Finance, and HENLO
- Gummi: Revolutionizing Leveraged Trading and Liquidity Provision on Berachain
- Ondo (ONDO) Price Prediction 2025,2026-2030
- Exploring Berachain: A New Frontier in DeFi
- Mode Network: Smarter DeFi with AI and Layer 2 Scaling
- Chainlink (LINK) Price Prediction 2025, 2026-2030
- GRIFFAIN: A Deep Dive into the Hottest Innovation
- Unlock DeFi: HeyAnon's Impact on Trading & Investment
- Top Hat - the Hottest Token in the DeFi Market
- SOLV Protocol: Unlocking Bitcoin’s Potential in DeFi
- Spore (SPORE): Driving Sustainable Growth Through Blockchain
- Meet the Hive: A Modular Network of Interoperable DeFi Agents
- What Is Wrapped MistCoin (WMC)?
- Understanding the STREAM Token and Streamflow Finance
- All You Need to Know: Symmio Protocol and $SYMM
- Evrmore: A Next-Gen Blockchain for Secure DeFi
- Breaking down HYPE: Hyperliquid’s Native Token in the Spotlight
- Velodrome Finance (VELO) Price Prediction 2025-2030
- Warthog(WART): The Blockchain Redefining DeFi and Solving Sandwich Attacks
- OneSwap Revolutionizes DeFi with ONES Deflationary Token
- Revolutionizing Token Launches: How blnk.fun Empowers Solana Projects with Blinks
- TrueFi (TRU) Price Prediction 2025-2030: Future Insights and Trends
- Suilend(SEND): The Future of Lending Protocols
- Introducing USUAL Cryptocurrency: A Revolutionary Approach to Decentralized Finance
- Exploring CULT: The Token Behind the Remilia Collective’s Vision
- Exploring Sui: A Resilient Blockchain for DeFi Growth
- What Is Chainlink & How Does it Work?
- Exploring OM Token: A Deep Dive into MANTRA
- The SOPH Token: A Deep Dive into Its Role in the Sophon Blockchain Ecosystem
- Morpho (MORPHO) Cryptocurrency’s Launch on CoinEx: What to Expect
- Exploring Polkadot: The Blockchain Connector Revolutionizing DeFi
- Avalanche: Unleashing the Future of DeFi
- What Is Realio and How to Trade $RIO Tokens?
- Introducing Autolayer: The Largest Restaking Marketplace
- Jupiter (JUP) Price Prediction 2024, 2025-2030
- LogX Network: Revolutionizing On-Chain Trading Platforms
- Banana Game Hits 1M Users: What's Next?
- Velo Lab Web 3+ Ecosystem: Empowering Businesses and Individuals
- Puffer Finance (PUFFER): Revolutionizing ETH Staking with Liquid Restaking Protocols
- Unlocking the Future of Cross-Chain Transactions with Arix (ARIX) Token
- What Is Pax Gold and How to Buy PAXG Coins?
- What Is Aerodrome and How to Buy AERO Tokens?
- What Is Jito and How to Trade JTO Tokens?
- What Is ORDS Token?
- What Is Kamino and How to Trade KMNO?
- What Is Ether.fi and How to Trade ETHFI?
- What Is AURA Coin on Solana and How to Buy AURA?
- What Is Sologenic and How to Buy SOLO?
- What Is Orion Protocol and How to Buy ORN?
- What Is MDEX (MDX)?
- What Makes PAW Chain Unique in Crypto?
- What Is AllianceBlock Nexera and How to Buy NXRA Tokens?
- What Is SuiPad and How to Buy SUIP Tokens?
- What Is Banana Gun and How to Buy BANANA Tokens?
- Exploring Linea: A Scalable, User-Friendly Platform for Decentralized Applications
- What Is Mendi Finance (MENDI)?
- Unlocking Financial Opportunities: Discover the Game-Changing MENDI Token on Linea Blockchain!
- Unlocking DeFi Potential: Introducing FACTR Token by Defactor, Revolutionizing Real-World Asset Financing
- What Is Jupiter and How to Buy JUP Tokens?
- SwissCheese (SWCH) Crypto: First-Ever Decentralized Stock Exchange
- Unveiling Ondo Finance: Bridging Traditional and Decentralized Finance
- Decoding Ethena's Remarkable Market Performance
- What Is Flamingo and How to Buy FLM Tokens?
- What Is Sui and How to Buy SUI Tokens?
- What Is Maker and How to Buy MKR Tokens?
- What Is DAI and How to Buy DAI Crypto?
- What Is Uniswap and How to Buy UNI Tokens?
- What Is Aave Protocol and How to Buy AAVE Tokens?
- What Is ATOR Protocol and How to Buy ATOR Tokens?
- What Is Bounce and How to Buy AUCTION?
- What Is Unibot (UNIBOT)?
- What Is Pendle Finance and How to Buy PENDLE Tokens?
- What Is FURUCOMBO Token?
- What Is Chainlink and How to Buy LINK?
- What Is Cronos (CRO) and How to Buy CRO?
- What Is UMA’s Optimistic Oracle and Where to Buy UMA?
- What Is Injective (INJ) and How to Buy INJ?
- What Is Chromia (CHR) and How to Buy?
- Move-based Public Chains: Sui vs Aptos
- A Full Introduction to Sui’s Tokenomics and Market Statistics
- How Does Sui Attract New Users Without Airdrop?
- What is Goldfinch Protocol?
- Born for Lending: How Does Beta Finance Reduce Volatility of the Crypto Market?
- Another Wave of Highly Lucrative Airdrops, What is DYDX?
-
- Privacy
- DIMO (DIMO) Crypto Price Prediction 2025, 2026-2030
- What Is a Private Key in Crypto? How It Protects Your Digital Assets
- Tari Mainnet Launch: Privacy, Accessibility, and the Next Generation of Mining
- Nillion (NIL) Price Prediction 2025, 2026-2030
- Enhancing Privacy on Ethereum: An In-Depth Look at Tornado Cash's Decentralized Protocol and How to Buy on CoinEx
- What Is the Anyone Protocol and How to Trade ANYONE Tokens?
- What Is ZANO and How to Buy ZANO?
- What Is Monero and How to Buy XMR Tokens?
- What Is WorldCoin and How to Buy WLD?
- What Is Namecoin and How to Buy NMC Tokens?
- What Is Arpa Network and How Does It Work?
- What Is Raptoreum and How to Buy RTM?
- What Is Automata Network and How to Buy ATA?
- What Is Dash and How to Buy DASH?
- What Is XHV Coin?
- What Is Ergo and How to Buy ERG?
-
- BNB Chain
- What is Codatta (XNY)? Exploring the Decentralized AI Knowledge Protocol
- USDR and the Future of Stablecoins: Regulation, Transparency, and Trust in a Digital Dollar
- What Is Donkey Meme Coin? Exploring DONKEY on BNB Chain
- Recent and Upcoming Crypto Listings in 2025
- SKYAI: Pioneering Blockchain-Native AI Infrastructure
- Understanding BIGPUMP ($PUMP): A Meme Coin on the Rise
- JLP Explained: Fair Launch Platform Helps Blockchain Projects Launch and Expansion
- TSTBSC Token: The Ultimate Guide to Understanding Test Tokens on BNB Chain
- Exploring BABYBNB: A Deep Dive into Baby BNB
- Top 5 BSC Tokens to Invest in 2024
- Exploring BCCOIN: The Future of Crypto Spending and Earning with BlackCard
- What Is Space ID and How to Buy ID Tokens?
- What Is BurgerCities and BURGER Token?
- What Is ANKR Coin and How to Buy?
- HOOK (Hooked Protocol): With 2 Million+ MAU, Will X-to-Earn Be the Next Killer Application
- What Is Binance USD (BUSD) ?
-
- Metaverse
- TopGoal & $GOAL: Web3 Football Gaming and Market Trends
- What Is Hyperfy (HYPERFY) and How to Buy HYPERFY?
- What Is DUST?
- What Is Bloktopia and How to Buy BLOK?
- What Is Radio Caca and How to Buy RACA?
- What Is Mines of Dalarnia (DAR)?
- What Is Step App (FITFI) and How to Buy?
- What Is The Sandbox and How to Buy SAND?
-
- NFT
- XAI Games and XAI Tokens: Revolutionizing Web3 Gaming
- USD₮ on Kaia Chain : Opportunities in Asia Digital Economy
- Berachain NFT Ecosystem: A Deep Dive into the Bear-Themed Blockchain Revolution
- Cat Gold Miner: Play-to-Earn NFT Game on Telegram
- Exploring the ISLAND Token: Unlocking Opportunities in the Nifty Island Ecosystem
- The Rise of Pudgy Penguins: Pioneers in Crypto Adoption
- Everything You Need to Know About the $ME Token: Magic Eden New Ecosystem Currency
- Arbitrum's First Stylus NFT Drop: 'Infinite Rainbows'
- Best NFT Games for Crypto Earnings in 2024: Introducing Gaming to Blockchain
- Anime NFT: Top Anime-Inspired NFTs 2023
- What Is OpenDAO (SOS)?
- Animoca Brands Launches its Official Coin, MOCA
- Blur Becomes the Game Changer in the Market as the Dark Horse Platform Issues its Token
- What Is Tensor and How to Buy and Trade TNSR?
- Best NFT Crypto Coins 2022 in the Crypto Market
- What Is Ethernity Chain and What Are Ethernity STONES?
- Loot Plummeting by 75%, What Happened?
- Earn Coins by Playing Racing Games? Things You Need to Know about the NFT Project REVV
-
- Others
- Tree (TREE) Crypto Price Prediction 2025, 2026-2030
- Best Crypto to Buy in May 2025
- Berachain Explained: Proof-of-Liquidity and Its Impact
- Onyxcoin (XCN) Price Prediction 2025, 2026-2030
- What Is Gold RWA in Crypto: Exploring Gold-Pegged Tokens XAUT, PAXG, and More
- What Is Resolv USR: The True Delta-Neutral Stablecoin Explained
- Deep Dive into Pi Network: Cryptocurrency Mining Innovation
- Pi Network’s Uncertainty: Delays, Listings & Price Gaps
- XION: Pioneering User-Friendly Blockchain Solutions for Web3
- The Rise and Challenges of $BIO: Insights into Bio Protocol
- The Impact of Plume Coin on Future Real-World Assets
- JamboPhone 2: Future of Web3 in Emerging Markets
- LOFI's Impact on Global Warming and Environmental Change
- What Is Alloy? Understanding Tether’s Gold-Backed Stablecoin (aUSD₮)
- How Big Pharmai Is Redefining the Backbone of Decentralized Science
- SpaceXCoin Price Prediction 2025, 2026-2030
- Future of Business Automation with Swarms Architecture
- Berachain: Redefining Layer-1 with Proof of Liquidity Consensus
- Best RWA Cryptos to Invest In: Top Performers & Risks
- Top 5 Oracle Cryptos Dominating 2024 and to Watch in 2025
- Revolutionizing Science with Blockchain-Powered Innovation
- How Will Ripple's RLUSD Affect the Stablecoin Market?
- XRP Price Predictions: A Comprehensive Analysis for 2025, 2026-2030
- Everything You Need to Know About KEIRO on the Kaspa Network
- NEAR Protocol: A Gateway to Decentralized Applications
- Exploring OG Fan Token: A Deep Dive into the OG Esports Project
- What Is TRON (TRX) and How Does It Work?
- What Is Carbon Browser and How to Trade $CSIX Tokens?
- What Is Verasity and How to Trade $VRA Tokens?
- Chiliz Chain: Revolutionizing the Sports Industry with Blockchain Technology
- APE Token Surges 102% After Bridge Launch: Is This the Start of a New Era?
- Kasper: Empowering Communities Through Fairness and Transparency in Cryptocurrency
- Aleo Mainnet: A New Era for Decentralized Apps
- Understanding the Role of M^0 in Decentralized Crypto-dollar Issuance
- Unpacking the Hype Behind Buz Economy (BUZ): The First-ever Launchpad on Base
- Exploring GIZMO: A Deep Dive into GIZMO IMAGINARY KITTEN
- Is Sui Truly the “Solana Killer” in the Layer-1 Battle?
- Crudo Protocol: Revolutionizing the Oil and Gas Industry with Web3 Technology
- Top 5 Largest Crypto Gainers in Q3 2024
- What is SafeDAO and What is the SAFE Token?
- What Is Crypto Raiders (RAIDER)?
- What Is the Propy Platform and How to Buy PRO?
- What Is Shentu Chain and How to Buy CTK Tokens?
- What Is BePro Network and How to Buy BEPRO Coins?
- What Is AERGO and How to Buy AERGO Coins?
- 4 Fan Tokens on Chiliz Chain You Don't Want to Miss Out on
- What Are Real World Assets (RWA) in Crypto & Top 5 RWA Tokens to Watch in 2024
- W Token: Bridging Boundaries, Fueling the Future of Blockchain Innovation
- What Is THORChain and How to Buy RUNE Tokens?
- What Is Stellar and How to Buy XLM Coins?
- What Is SUN and How to Buy SUN Tokens?
- What Is Tron Crypto and How to Buy TRX?
- What Is Fantom (FTM)?
- The Rise of Chiliz Blockchain: Revolutionizing Sports and Entertainment Industries
- What Is BitTorrent Protocol and How to Buy BTT Tokens?
- What Is Thorchain?
- FTM’s TVL Exceeds $10 Billion and Ranks 3rd: CoinEx Lists Many Fantom-powered tokens
-
- Crypto Basics
- What's New
- BNB Attestation Service (BAS): Building Trust and Identity in Decentralized Ecosyst
- Top 5 Solana Telegram Trading Bots You Should Know in 2025
- Top 5 Smart Contract Platforms in 2025
- Top 5 Crypto Airdrops to Watch in August 2025
- What is Ghost Chain in Crypto? How To Identify Dormant or Dead Crypto Projects in 2025
- Dropee Question of the Day & Today Answer 4-5 September
- Cronos (CRO) Price Prediction 2025–2030: Can CRO Regain Its Momentum?
- CJB Crypto & XRP-Bitcoin Mining: A New Approach to Earning Passive BTC in 2025
- What is Plasma (XPL)? The Layer 1 Blockchain Built for Stablecoin Payments
- CJB Crypto & XRP-Bitcoin Mining: A New Approach to Earning Passive BTC in 2025
- WLFI Token Explained: Trump-Backed Crypto Project and Its Market Impact
- International Dog Day 2025: Celebrating Top Dog Memecoins and Their Enduring Appeal
- Why Is the Crypto Market Down Today Despite Fed Chair Powell's Dovish Jackson Hole Speech?
- What Is the Pudgy Penguins (PENGU) ETF? Potential Launch Timeline and Price Insights for 2025
- Best Free Crypto Trading Bots on Telegram in 2025: Automate Your Trades Like a Pro
- OKB (OKB) Price Prediction 2025, 2026-2030: Can Exchange Tokens Redefine Utility in the Next Bull Market?
- API3 (API3) Price Prediction 2025, 2026-2030
- Why is Crypto Down Today? August 20, 2025
- Bitcoin Price Reached $124K: What’s Next After Its All-Time High (ATH)?
- Bitcoin Price Analysis Based on CME Gap: Understanding Its Types and Importance
- What is Yala ($YALA): Powering Governance, Growth, and Security in Bitcoin DeFi
- Bitcoin Price Hits $123K in 2025: Driving BRC 2.0 and Web3 Growth
- Top Crypto Tokens with Strong Exchange Listings in 2025 (Ranked by Performance)
- Best Crypto Signals Telegram Groups in 2025: Top 10 Picks for Smarter Trading
- Top 4 Crypto Projects to Watch in Late 2025
- How to Mine Bitcoin Using AI in 2025
- Trump Order Expands 401(k) Options to Crypto, Private Equity, and Real Estate
- Best Crypto Staking Yields 2025: Up to 22% APY
- Unlocking Stable Profits in DeFi: How to Earn with Pendle's New BOROS Product and V2 App
- Best Privacy Coins for Anonymous Transactions
- What's the Best Yield Farming Strategy 2025?
- Qubitcoin (QTC) Price Prediction: Can Quantum-Safe Blockchain Secure the Future of Digital Finance?
- Succinct (PROVE) Price Prediction: Shaping the Future of Trustless Blockchain Verification
- WLFI : What Is It & How It Makes USD1 the Next Big Stablecoin
- Vine Coin (VINE) Price Prediction 2025, 2026-2030
- League of Kingdoms (LOKA) Price Prediction 2025, 2026-2030
- Arena-Z (A2Z) Price Prediction 2025, 2026-2030
- What Are PROVE Tokens? Unlocking Zero-Knowledge Proofs with Succinct Prover Network
- Introducing TOWNS: The Web3-Native Social Protocol for Digital Communities
- Inside PLAY: The Token Turning Game Time into Real Value
- What Is Mamo (MAMO)? Your Guide to the AI-Powered Crypto Finance Platform
- SEC's Project Crypto: Transforming the U.S. Crypto Market
- NOICE: Empowering Creators with Tokenized Social Tipping on Decentralized Networks
- SharpLink Gaming’s $780 Million Ethereum Purchase: Could It Be the Catalyst for ETH’s Next All-Time High?
- What is Uranus (URANUS)? Your Guide to the Solana Meme Coin Taking 2025 by Storm
- Bitcoin vs Stablecoin: Store of Value vs Stability in the Digital Economy
- XRP vs SOL: Comparing Ripple and Solana in 2025 and Beyond
- Top 4 Crypto Projects to Watch in Late 2025
- Omni Network (OMNI) Price Prediction 2025, 2026-2030
- Treehouse ETH (TETH) Price Prediction 2025, 2026-2030
-
- Crypto 101
- Will an Altcoin Season Ignite in 2025? Analyzing Market Dynamics and Potential Catalysts
- What Do You Call It When a Token's Price Skyrockets: Understand the Lingo in Crypto
- InfoFi Explained: What Is Nansen and How Does It Work
- What Does FOMO Mean in Crypto & How to Avoid It?
- What Is the Crypto.com Showdown? Who Won the Crypto Showdown?
- What Is Compound Finance, and How Does It Work?
- What Is the Altcoin Season Index? How Is It Calculated?
- What Is Crypto Airdrop and How Does It Work?
- Crypto Fear & Greed Index: What It Is and How It Works
- What is Lido & How it works: The ETH Liquid Staking Protocol
- What Is Port3 Network and How to Buy PORT3?
- What Are ZK-Rollups? The Evolution of Rollup Technology
- A Beginner's Guide to NFT Whitelists: Everything You Need to Know to Get Started
- Most Prevalent NFT and Crypto Slang
- Price Ceiling vs Price Floor: How Are They Different?
- What You Need to Know about Crypto Dominance?
- Crypto Slangs Acronym: GM, NGMI, WAGMI Meaning
- Understanding Brokers: A Comprehensive Guide
- Why Protecting Seed Phrase is Important?
- What NFT Staking Is and How It Works?
- Ethereum Blockchain Explorer
- Altcoin Season: What Is It? When And Why Does It Happen?
- Eyeing on the Next AI Opportunities
- Comparing Web2 vs Web3: Differences
- What Is Profit and Loss (PnL) in Crypto?
- What is the Proof of Reserve? How Can It Keep Assets Safe and Transparent?
- What Are Cryptocurrency Whales and Crypto Whales Tracking?
- What Is a Polygon Bridge and How Does It Work?
- What Is Polygon Matic?
- What is Metamask And How to Add Avalanche Network to Metamask?
- Cryptocurrency: The Hedge against Inflation
- What Are Crypto Keys: Public Keys and Private Keys?
- What Is The Bitcoin Tap Root Update?
- What is Centralized Finance (CeFi)?
- What Is Arbitrage and Cryptocurrency Arbitrage?
- GameFi: The Next Era of Blockchain Games
- What Is Airdrop in Cryptocurrency? Complete Beginner's Guide to Airdrops
- What Is BscScan? a Complete Guide for Beginners
- What Is CeFi and DeFi Crypto?
- The Difference Between Initial Supply, Total Supply, and Circulating Supply: Key Token Information That You Need to Know
- Cryptocurrency
- Why Is Crypto Price Going Up Today?
- Why Is Crypto Down in April? Bear Market Reasons & Implications
- How to Spot Buying Opportunities In Crypto Bear Market 2025
- UNUS SED (LEO) Price Prediction 2025, 2026-2030
- Top 5 Hyperliquid Ecosystem Coins 2025
- Crypto Bear Market in 2025: Top 5 Crypto Tokens to Buy
- Crypto Sentiment in 2025: Fear, Greed or Maturity
- Top Rehypothecated Crypto to Watch in 2025
- Tesla Coin Examined: Impacts on Cryptocurrency
- JioCoin Explained: Features, Market Position & Future in Blockchain
- Top 5 RWA Coins Will Explode in 2025
- Understanding the STREAM Token and Streamflow Finance
- The Launch of $TICO: Revolutionizing Gaming in the Middle East
- The Great Crypto Crash 2024: What Happened and What’s Next?
- Top 5 Crypto Moonshots of 2024: 1,000x Gainers on CoinEx
- Top 4 Coins to Watch in 2025: Next Crypto to Explode
- Best 5 Cryptocurrencies to Invest for The Upcoming 2025 Bull Run
- Top 6 Cryptocurrencies Of November, 2024
- Token Unlocks: Understanding Their Impact and How to Navigate Them
- What Are Cryptocurrency Resources? How to Find?
- Major Token Unlocks Coming Soon: What to Watch Out For?
- What Are Wrapped Cryptocurrencies? Are Wrapped Tokens Safe?
- What Are the Differences Between Crypto and Stocks?
- How to Find and Buy New Crypto Before Listing?
- Analyzing the Rise of Platform Tokens
- Crypto's Volatile Week and Future Market Factors
- Copa America 2024 Begins: Here Are the Top 8 Fan Tokens You Need to Know About for Long-term
- Top 10 Layer-1 Crypto Projects
- USDC May Overtake USDT; Ripple Wants to Share the Pie
- When to Sell Crypto?
- All You Need to Know about Crypto Faucets
- What Is Cryptocurrency Prediction?
- What Are Cryptocurrency Tokens?
- What Is Cryptocurrency?
- Why Do Young Investors Prefer Cryptocurrencies?
- How to Choose a Promising Cryptocurrency?
-
- AI & Big Data
- Ani Grok Companion (ANI): Deep Dive into the AI Anime Memecoin Revolution
- Top 3 Crypto AI Projects Set to Explode in 2025
- What Is Sahara AI? Exploring the Decentralized AI Blockchain Revolution
- Sahara AI (SAHARA) Price Prediction 2025, 2026-2030
- Griffain vs. Hive AI: Comparing Two AI-Driven Blockchain Tokens
- What Is REX (REVOX)? AI-Powered DeFi Protocol Revolutionizing Blockchain
- MIRAI: Revolutionizing Virtual Humans with AI and Web3
- The Evolution and Future of AI Agent Projects in Crypto: History, Challenges, and Prospects
- Elon Musk’s xAI Unveils Grok-3 AI Chatbot as AI Competition Heats Up
- SolyAI: Advancing AI Integration in Crypto
- Vapor: Shaping the Future of AI Agents with Hyperliquid
- Top AI and Gaming Projects on Berachain to Watch
- Introducing Humans AI: Making AI Work for Human
- DEGA: AI-Powered Game Development for the Web3 Era
- Virtuals Protocol: A Thriving AI Agent Ecosystem on Base Network
- Hyperliquid: Advancing DeFi with AI Solutions
- Realis Worlds: Unlocking the Future of AI and Blockchain
- Exploring the Future of AI and Web3: Insights from 0G Labs
- Create AI (CREATE): Transforming Content with AI
- MCS Token: An AI-Powered Medical Diagnosis
- How BAD Is Setting a New Standard for AI Agent Protocols
- Top 6 AI Agent Tokens That Could Explode in 2025!
- OpenAI’s GPT-4o: What Crypto Traders Are Expecting
- With the Explosion of AI Technology, What New Business Model Will Web3 + AI Collide With?
-
- Bitcoin
- CJB Crypto & XRP-Bitcoin Mining: A New Approach to Earning Passive BTC in 2025
- Why is Crypto Down Today? August 20, 2025
- Bitcoin Price Analysis Based on CME Gap: Understanding Its Types and Importance
- Bitcoin Price Hits $123K in 2025: Driving BRC 2.0 and Web3 Growth
- How to Mine Bitcoin Using AI in 2025
- Trump Order Expands 401(k) Options to Crypto, Private Equity, and Real Estate
- METHANE Token and the Alkanes Protocol: Unlocking Bitcoin’s Next Frontier
- Bitcoin Price Hits Record High at $123,000: What Lies Ahead?
- CoinEx Research June 2025 Report: Bitcoin in the Crossfire
- What Is Bitcoin Core: How the Software Powers Bitcoin and Why It's Sparking Debate Recently
- Government-Led Strategic Bitcoin Reserves: A New Frontier in National Finance
- Top Bitcoin ATM Operators 2025: Global & U.S. Crypto ATM Network
- What Are Privacy Coins? A Beginner’s Guide to Anonymous Cryptocurrencies
- Mapping US Federal and State-level Bitcoin Reserves and Their Impact on BTC Price
- Crypto Bear Market: Is It Here Already? Alt Season Predictions for 2025
- Bitcoin Bonds Explained: The Key Driver to Bitcoin Price in the Post-Era of Trump’s Tariffs
- Bitcoin Price Forecast: Would $74k Be Possible Before July?
- Bitcoin Struggles Below $65K, Tumbling Other Altcoins
- Unveiling Bitcoin Halving: What Is Bitcoin Halving and Why Was It Designed?
- Unveiling Bitcoin Halving: What Other Cryptocurrencies Have a Halving Besides Bitcoin?
- Unveiling Bitcoin Halving: How Does the Bitcoin Halving Affect the Market?
- What Is Bitcoin? Basics Explained
- The Next Bitcoin Hike May Take Longer Than You Think
- What Exactly Is an Epic Sat? Everything You Need to Know
- How Does Bitcoin Maintain Its Security?
-
- Ethereum
- Bitcoin Price Reached $124K: What’s Next After Its All-Time High (ATH)?
- Succinct (PROVE) Price Prediction: Shaping the Future of Trustless Blockchain Verification
- What Are PROVE Tokens? Unlocking Zero-Knowledge Proofs with Succinct Prover Network
- SEC's Project Crypto: Transforming the U.S. Crypto Market
- SharpLink Gaming’s $780 Million Ethereum Purchase: Could It Be the Catalyst for ETH’s Next All-Time High?
- Omni Network (OMNI) Price Prediction 2025, 2026-2030
- What is Gamma Exposure? How to Use This Option Data to Predict Bitcoin and Ethereum Prices?
- Tokenized Stocks of RWAs: A Catalyst for the 2025 Altcoin Season?
- Trump’s Crypto Blue Chip ETF and Trump’s Stance on Crypto
- Render (RENDER) Price Prediction 2025–2030
- What Is Unichain and What Its Explosive TVL Growth Means for DeFi
- The Ethereum Pectra Upgrade: Your Ultimate Guide to the Future of ETH
- What Is Monad: The High-Performance EVM-Compatible Blockchain Revolutionizing Crypto
- Promising Cryptos Amidst the Shanghai Upgrade
- What Is ERC-6551? The New Token Standard to Create Token-Bound Accounts
- Ethereum's EIP-3074 Upgrade and What to Expect
- Liquid Staking Derivatives Capitalizes on Ethereum’s Dencun Upgrade to Propel Web3 Innovation
- Ethereum Dencun Upgrade: Which Cryptos Stand to Benefit the Most?
- Understanding & Navigating The Upcoming Ethereum's Dencun Upgrade
- Ethereum's Dencun Upgrade: Transformational Impacts on Users, Devs and Enterprise
- Changes in the Crypto Market Following the Shapella Upgrade
- Significance of the Shapella Upgrade in Three Major Aspects
- Shanghai Upgrade Approaching: Ethereum Protocols You Should Know
- Does the Ethereum London Upgrade Mark A New Bull Run?
- From Ethereum 1.0 to Ethereum 2.0
-
- Blockchain
- What Is Bitcoin Depot and How Does It Work?
- Unlocking the Future of Computing: An Overview of Gradient Network
- Key Testnet Validator Partnerships with Hyperliquid
- Monad: Pioneering the Future of Blockchain Technology
- Pioneering Blockchain Innovations: Top Testnets to Watch in 2025
- What Is Canto Blockchain?
- How MicroVisionChain (MVC) Fixes the Biggest Problems in Blockchain for the Web3 Age
- BlockDAG: How Directed Acyclic Graphs are Transforming Blockchain Scalability
- Celestia: The World’s First Modular Blockchain Network—A Game Changer for Blockchain Development
- Blockchain and Data Privacy: A Comprehensive Overview
- Understanding Berachain: The High-Performance Blockchain Built on Proof-of-Liquidity Consensus
- Discover the Blast Ecosystem: Infrastructure Developments
- The TON Public Chain Ecosystem
- New Business Models and Opportunities in Web3
- New Social Scenes in Web3
- Web3 and Blockchain: From a Target of Skepticism to a Disruptor of Traditional Finance
- How DAOs in Web3 Change Relations of Production?
- The Eve of an Application Surge: A Review of the Current Development of Web3
- Behind Web3: Freedom, Privacy & Security, and Anti-Monopoly
- What Is Web3 Data Storage and How Does It Work?
- Why Web3 Needs Digital Identity?
- The Infrastructures of Web3
- How Do Web3 Domains Differ from Traditional Domains?
- What Is Web3 and Why Is Web3 Important?
- What Is Middleware in Web3?
- Web3 Block Explorers: All You Should Know
- Shibarium: What Is It & How Will It Impact SHIB?
- Peer-to-Peer Network Explained
- Blockchain Oracles: All You Want to Learn
- An In-Depth Guide to What Are Nodes and Their Importance in the Blockchain Industry
- What Is Blockchain: The Future of Internet
- An Introduction to Public Chains, Private Chains, and Consortium Chains
- Blockchain Application Thrives in the Corporate World as the Sector Welcomes a Drastic Increase in New Patents
- Backed by the Social Giant Kakao, What’s So Different about Klayth, the Star Public Chain in South Korea?
-
- ETF
- What Is the Pudgy Penguins (PENGU) ETF? Potential Launch Timeline and Price Insights for 2025
- SUI ETF Filing: Could This Blockchain Overtake Solana in 2025?
- Litecoin, Solana, HBAR ETFs: Which Will Gain SEC Approval First?
- Crypto ETFs in 2024: Key Achievements and Prospects for 2025
- Could the XRP ETF Application Revolutionize the Crypto Market?
- Understanding the Implications of the Latest SOL ETF Application
- VanEck's Ethereum Futures ETF Liquidation Might Spark New Growth Opportunities for Ethereum
- 5 Best Ethereum ETFs to Invest in 2024: Discover the Leading Options for Growth and Stability
- Ethereum ETF Approvals: Reactions among Institutions and Investors
- Inside the Launch: The Making and Impact of ETH ETF
- Bitcoin ETF Approval: Will the Crypto Market Welcome a Bull Market?
-
- PayFi
- Top 5 PayFi Projects to Keep an Eye on in 2025
- PayFi Explained: How Blockchain Payments Are Changing Finance in 2025
- What is PayFi and How It Revolutionizes Crypto Payments in 2024?
-
- PolitiFi
- Is Crypto Regulation Global in 2025?
- How Tariffs Impact the Crypto Market
- Trump's Tariff Crypto Impact: How Tariff Wars Shaped the Market
- Trump’s Reciprocal Tariffs Unveiled: How They Could Shape the Cryptocurrency Market
- White House Crypto Summit: Key Issues and Expectations
- Trump’s Crypto Reserve: How Investors Can Strengthen Strategy
- Top 7 PolitiFi and Trump-Themed Coins for the 2024 Election
- The Future of Crypto Under Trump’s Pro-Crypto Reign: Bold Moves, Big Promises
- The Silk Road Saga: Why Trump Pardoned Ross Ulbricht
- Who Is Bo Hines - The New Executive Director of Crypto Council Under Trump
- Trump Family's Influential Entry into the Cryptocurrency Market
- Influences on Orbiter Finance Supports Trump’s Inauguration
- January 20 and Beyond: What to Expect After Trump Takes Office?
- The Impact of U.S. Elections on the Cryptocurrency Market: Key Considerations for Investors
- Understanding the Federal Reserve: The Significance of the FOMC
- PolitiFi Tokens: A New Trend in Crypto Trading
- Trump vs. Harris: Which Party Would Favour Crypto the Most?
- How Serious Are Trump and Other Presidential Candidates about Cryptocurrency?
-
- Futures
- What Is FLock.io? Exploring the Decentralized AI Training Revolution
- What Are Futures Contracts?
- Differences Between Conventional Futures Contracts and Perpetual Futures Contracts
- Win Rate vs Profit/Loss Ratio, Which One is More Important in Futures Trading?
- Things You Should Know Before Starting to Trade Futures
- Beginner Tips on Opening Futures Orders
- Profit-making Opportunities Arising From the Funding Rate
- Types of Future Margins
- Ways to Calculate the Margin Rate
- The Importance of the Often-neglected Service Fee in Futures Trading
- Maximize Your Returns Through Futures against Market Swing
- The Top Concern for Futures Traders: How to Calculate the Unrealized PNL and the Realized PNL?
- The Three Prices in Futures Trading
- What Are Index Price and Mark Price in Crypto Exchanges?
- What are Limit Orders & Market Orders?
- Basic Concepts of Futures Trading that Beginners Should Know
- Why Does My Maintenance Margin Rate Increase When I Expand My Position?
- Factors Behind Forced Liquidation in Futures
- Beginner’s Guide: What are the Risks of Futures Trading?
- Improve Your Returns by Studying the Neglected Long-short Ratio
- Must-have Knowledge for Greenhand Traders: Isolated Margin vs. Cross Margin
- Causes Responsible for 90% of Forced Liquidations among Newbie Futures Traders
- Must-have Knowledge for Greenhand Traders: Maker vs. Taker
- Learn How to Place an Order Before Starting a Position in Futures Trading
- A Beginner’s Guide: The Difference Between Spot Trading and Contract Trading
- Must Contract Traders Pay the Platform in the Event of Bankrupt Positions?
- The Differences Between Linear Futures Contracts and Inverse Futures Contracts
- Determine the Right Margin and Margin Rate to Avoid Forced Liquidation!
- Contract Know-how: Leverage & Margin Rate
-
- MEME
- International Dog Day 2025: Celebrating Top Dog Memecoins and Their Enduring Appeal
- Vine Coin (VINE) Price Prediction 2025, 2026-2030
- What is PUMP Token: The Heart of Solana’s Leading Meme Coin Launchpad
- AI Companions and Crypto: From Grok Ani to the Future of Web3 Relationships
- What Is the Memecoin Supercycle, and When is It Coming 2025?
- FLOKI (FLOKI) Price Prediction 2025, 2026-2030
- Meme Coins Vs. Blue Chips: Where Should You Invest In?
- Top Trump Family Memecoins to Watch In 2025
- Updates to Pump.fun: Expanding Features & Potential Future Token Launch
- The Role of focEliza in the Eliza Ecosystem
- Moonshot: Revolutionizing Memecoin Trading on the Solana Blockchain
- How Catizen Is Revolutionizing Play-to-Earn Gaming on Telegram
-
- DeFi
- BNB Attestation Service (BAS): Building Trust and Identity in Decentralized Ecosyst
- Top 5 Smart Contract Platforms in 2025
- What is Ghost Chain in Crypto? How To Identify Dormant or Dead Crypto Projects in 2025
- Cronos (CRO) Price Prediction 2025–2030: Can CRO Regain Its Momentum?
- WLFI Token Explained: Trump-Backed Crypto Project and Its Market Impact
- Why Is the Crypto Market Down Today Despite Fed Chair Powell's Dovish Jackson Hole Speech?
- Best Free Crypto Trading Bots on Telegram in 2025: Automate Your Trades Like a Pro
- API3 (API3) Price Prediction 2025, 2026-2030
- OKB (OKB) Price Prediction 2025, 2026-2030: Can Exchange Tokens Redefine Utility in the Next Bull Market?
- What is Yala ($YALA): Powering Governance, Growth, and Security in Bitcoin DeFi
- Top 4 Crypto Projects to Watch in Late 2025
- Top Crypto Tokens with Strong Exchange Listings in 2025 (Ranked by Performance)
- Best Crypto Signals Telegram Groups in 2025: Top 10 Picks for Smarter Trading
- Unlocking Stable Profits in DeFi: How to Earn with Pendle's New BOROS Product and V2 App
- What's the Best Yield Farming Strategy 2025?
- Qubitcoin (QTC) Price Prediction: Can Quantum-Safe Blockchain Secure the Future of Digital Finance?
- WLFI : What Is It & How It Makes USD1 the Next Big Stablecoin
- Introducing TOWNS: The Web3-Native Social Protocol for Digital Communities
- Inside PLAY: The Token Turning Game Time into Real Value
- What Is Mamo (MAMO)? Your Guide to the AI-Powered Crypto Finance Platform
- Bitcoin vs Stablecoin: Store of Value vs Stability in the Digital Economy
- Top 4 Crypto Projects to Watch in Late 2025
- Treehouse ETH (TETH) Price Prediction 2025, 2026-2030
- IKA (IKA) Price Prediction 2025, 2026-2030
- Top 10 DeFi Lending Platforms for 2025
- What Is Infinity Ground (AIN)? Exploring the Future of AI-Powered Decentralized Apps
- US Crypto Regulations 2025: Complete Guide and Future Outlook
- Top 5 Crypto AI Trading Tools Every Trader Needs in 2025
- The 5 Best Crypto Tax Software in 2025 Ranking
- What is Caldera in Crypto? Transforming Ethereum Scalability with Rollup-as-a-Service
- What is T3rn (TRN)? Unlocking Blockchain Interoperability with Universal Execution
- What Is Ethereum DeFi and Why It Matters in the Future of Finance
- Understanding Hyperion: The Gateway to DeFi on Aptos
- Is Altcoin Season Coming? An In-Depth Look at Crypto Market Shifts in 2025
- Top Best No KYC Crypto Casinos to Watch in 2025
- The First Verifiable AI Agent Unlocking Trustless Crypto Automation
- Is Crypto Allowed in the Emirates? Emirates Airline Partnership Explained
- How to Buy Stock Tokens in Nigeria: Beginner’s Guide 2025
- How to Buy Stock Tokens in Nigeria: Beginner’s Guide 2025
- Hyperliquid: Revolutionizing Decentralized Trading
- CoinEx P2P in Africa: 5 Key Questions Answered
- Will BitMine's Ethereum MicroStrategy Approach Propel ETH to New All-Time Highs?
- What Is Stock Tokenization and How It Works in Crypto
- Top InfoFi Projects to Watch in 2025: Kaito, Ocean, Fetch & More
- Sei Price Skyrocketed 50%: How Circle’s Investment Sparked a Market Frenzy
- The CLARITY Act of 2025: A Comprehensive Framework to Transform U.S. Crypto Regulation
- Circle Goes Public: Will the Crypto Market Soar or Stumble Due to Circle IPO?
- What Is Dropee Airdrop and How Does It Work? A Beginner’s Guide
- RAILGUN (RAIL) Price Prediction 2025–2030
- Understanding BTC Dominance and Its Impact on the Crypto Market
- Crypto Bull Run 2025: Key Tips to Profit for Average Investors
- Mezo: Bridging Bitcoin and Everyday Finance
- What Is KernelDAO? Pioneering Multi-Chain Restaking Protocol
- Fogo Blockchain: The Future of High-Performance Decentralized Finance
- Top 10 Defi Protocols Disrupting Global Finance
- Cod3x: No-Code Trading Bots Revolutionizing DeFi Automation
- A Deep Dive into Hyperliquid Robust Lending Mechanisms
- Empowering DeFi Innovations in the Hyperliquid Ecosystem
- Cookie (COOKIE): Redefining Decentralized Finance
- Top DeFi Trends to Anticipate in 2024: Reshaping the Future of Decentralized Finance
-
- DEX
- Tradoor: Revolutionizing Decentralized Trading on TON with Unmatched Speed and Innovation
- What Is Valantis: A Modular Decentralized Exchange Shaping the Future of DeFi
- Berachain: Deep Dive into the Three Biggest DEX Projects
- What Is PancakeSwap and How to Use It ?
- The Progress of the DEX OneSwap
- Differences and Similarities Between DEX and CEX
-
- Layer 2
- NOICE: Empowering Creators with Tokenized Social Tipping on Decentralized Networks
- Novastro (NOVAS): Tokenizing Real-World Assets with Modular Blockchain and AI Innovation
- Lagrange (LA) Price Prediction 2025, 2026–2030: Can ZK Proofs Lead a Comeback?
- Arbitrum (ARB) Price Prediction 2025, 2026-2030 Will ARB Regain Its All-Time High or Settle into Layer 2 Maturity?
- Paradex and the DIME Token: Innovating Decentralized Derivatives and DeFi Ecosystem
- DoubleZero: Revolutionizing Internet Speed and Blockchain Scalability with Decentralized Networks
- EDGEN (LayerEdge) Price Prediction 2025–2030
- Layer 0 vs Layer 1 vs Layer 2: All You Need to Know
- What Is Bitcoin L2 Spark? A Guide to High-Performance Blockchain Solutions
- Zircuit: Hybrid L2 Merging ZK-Rollups & Optimistic Rollups
- Understanding Layer 2 Solutions: Scroll's Role in Enhancing Ethereum's Scalability and Functionality
- Introducing DuckChain: The First EVM-Compatible TON L2 Solution Transforming Blockchain Scalability
- Ethereum's Dencun Upgrade: Layer 2 Solutions Scaling New Heights
-
- Mining
- CJB Crypto & XRP-Bitcoin Mining: A New Approach to Earning Passive BTC in 2025
- 8 Best Crypto to Mine in 2025: Is Crypto Mining Still Worth It?
- What Is Crypto Mining and How Does It Work?
- How Is Crypto Minting Different from Crypto Mining?
- What Is Bitcoin Mining And How It Works?
-
- NFT
- League of Kingdoms (LOKA) Price Prediction 2025, 2026-2030
- Arena-Z (A2Z) Price Prediction 2025, 2026-2030
- GAEA: A Decentralized AI Platform Powered by Community Resources
- What Is an NFT Smart Contract and How Does It Work?
- Why Do People Buy NFT?
- Explore Magic Eden: Solana’s Premier NFT Marketplace
- Everything You Should Know About NFT Screenshots
- What Are Sports NFTs? Are Sports NFT Valuable?
- What Are P2E (Play-to-Earn) NFT Games?
- Great Platforms for You to Earn the First NFT Profit as a Musician
- With Facebook and Twitter Joining the Market, Why do Giants Favor NFT?
- OpenSea: The Monopolistic NFT Leader You Have to Know About
- What Is NFT? What Makes NFT So Popular?
-
- Solana
- Top 5 Solana Telegram Trading Bots You Should Know in 2025
- What is Uranus (URANUS)? Your Guide to the Solana Meme Coin Taking 2025 by Storm
- XRP vs SOL: Comparing Ripple and Solana in 2025 and Beyond
- Graphite Protocol (GP): Powering the Future of Creator Economies with No-Code Web3 Infrast
- 5 Top DePin Projects to Watch Out For in 2025
- Yala: Bitcoin’s Gateway to Real-World Yield
- SUPRA: The Full-Stack Blockchain Powering Next-Gen Super dApps
- Tokenized Stocks of RWAs: A Catalyst for the 2025 Altcoin Season?
- Dropee Question of the Day & Today Answer 4-5 September
- XRP vs. Solana: The Next Crypto ETF Approval Race
- Concerns Arise as Restaking Makes Its Way to Solana Post-Ethereum
- How Does Only1, Solana’s First NFT Platform, Disrupt Conventional SNS?
- Does Solana’s 18-hour Network Outage Raise Doubts about Its Decentralization?
-
- Stablecoin
- What is Plasma (XPL)? The Layer 1 Blockchain Built for Stablecoin Payments
- Top 5 Stablecoins for Cross-Border Payments in 2025
- USDQ: The MiCA-Compliant Stablecoin Bridging Europe and Asia’s Regulated Crypto Future
- Top 5 Stablecoins You Should Know in 2025
- Understanding CBDCs and Stablecoins: What’s the Real Difference?
- What Are Stablecoins: How They Work, History, Types
- What Is EURC? The Largest Euro Stablecoin Backed by Real Euros
- What Is Stablecoin Legislation? Understanding Regulations, Challenges, and Future Trends
- USDT vs. USDC: Can Tether Stay Ahead in the Stablecoin Race?
- Tether’s MiCA Challenge: Compliance or European Market Exit?
- What Stablecoin Would Help Ripple against SEC Lawsuit
- Everything You Need to Know About Stablecoins
-
- Staking
- Best Crypto Staking Yields 2025: Up to 22% APY
- Top 10 Liquid Staking Protocols in 2024 and How to Buy Their Tokens
- Kintsu: Revolutionizing Liquid Staking on Monad
- Infrared: Pioneering Liquid Staking and Proof of Liquidity Solutions on Berachain
- Liquid Staking Governance Tokens Yearly Analysis
- The Top 5 Solana Liquid Staking Platforms
- What Is Staking in Crypto?
-
- Trading
- Kuru Exchange: A New Era of On-Chain Trading
- Stop Loss and Take Profit: Essential Tools for Crypto Trading Success
- The Psychology of Crypto Trading: Overcoming Fear and Greed
- Understanding the Order Book in Cryptocurrency Trading
- Understanding Crypto Market Hours: Best Times to Trade Cryptocurrency
- Best 5 Ways to Earn Passive Income from Cryptocurrency
- Cryptocurrency Trading for Beginners: Your Ultimate Guide to Getting Started
- How to Trade on Margin?
- When Is the Best Time to Buy Bitcoin?
- Introduction to Telegram Trading Bots
- What Is a Carry Trade & What Are the Risks?
- How to Identify Trading Setup? Classic Day Trading Setup
- A Step-by-Step Guide to Cryptocurrency Spot Trading
- Terms of Contract Trading You Should Learn Before Opening an Order
-
- Wallet
- Top 4 TON Wallets For Storing Your TON and Jettons
- How to Use Telegram Wallet? Step-by-Step Crypto on Mobile
- Best Crypto Wallets for Beginners 2025
- Cold Wallet vs Hot Wallet: What It Is, How It Works
- What Is a Digital Wallet and Cryptocurrency Wallet?
- What Is WalletConnect? The Ultimate WalletConnect Guide
- Metaverse
- What Is MetaHero? Unlocking Lifelike 3D Avatars with the $HERO Token
- What Are Metaverse and Metaverse Gaming?
- How Investors Make Passive Income on Metaverse?
- A New Opportunity of Profit-making, What Is Metaverse?
-
- Others
- Best Privacy Coins for Anonymous Transactions
- Bitcoin & Stocks: 2025 Correlation Trends
- How Is RWA Tokenization Changing Crypto in 2025?
- Why Are Big Firms Hoarding Bitcoin in 2025?
- What Is Crypto Explode AI App and How Does It Work?
- Top 5 Crypto Sports Betting Sites to Watch in 2025
- Polymarket: Revolutionizing Decentralized Prediction Markets with Blockchain Technology
- A Comprehensive Review of The Best Bitcoin and Crypto Sports Betting Websites in 2025
- Monad’s Testnet Hits 1B+ Transactions: The Next EVM Layer 1 Nears Mainnet Launch
- Best Crypto Casino Like Lucky Block
- What Is Succinct Crypto: The Rust-Powered Network for Scalable ZK Proofs
- InfoFi: Speculation or Financial Innovation?
- Nillion: Pioneering Decentralized Data Privacy
- Berachain Gaming: Pushing the Boundaries of Blockchain Entertainment
- Unlocking Innovation: The Power of Hackathons
- The Future of Crypto Gaming in 2025: Trends, Earnings, and What to Expect
- On-Chain Transactions Explained: How Blockchain Works, Key Benefits, Challenges, and Use Cases
- Understanding the Cytonic Network: A New Era of Blockchain Interoperability
- RWAs Hit $17B as Bitcoin Dips—Are Institutions Shifting Away?
- DeSci Labs and DeSci Publish: Pioneering the Future of Scientific Research
- Top 5 Crypto Airdrops to Watch in June 2025
- Anthropic and Claude: Leading the Charge in AI Safety and Research
- Automata and the Superchain: Verifiable Machines Redefins Trust in AI
- Top 5 Crypto Airdrops to Watch in August 2025
- Top 10 Crypto Misconceptions & Myths
- Everything You Need to Know About Cookie3 for Web3
- UniCross: Revolutionizing Bitcoin with Layer 2 Inscription Minting
- A Comprehensive Comparison Between XRP and XLM
- SocialFi Trends in 2024: Transforming Social Media with DeFi
- Maximize Your Crypto Earnings with ME/USDT AMM: High APY and Profits Explained
- Maximizing Your Crypto Savings: A Comprehensive Guide to CoinEx's Financial Account for USDT
- Crypto Airdrops: Best Upcoming Crypto Airdrops in December 2024
- Unlock Passive Income with CoinEx AMM: Your Gateway to High-APY Opportunities
- Zero-Knowledge Proofs (ZKPs) in Web3 Security: A Privacy Revolution
- The Quantum Apocalypse: Will Blockchain Survive the Quantum Leap?
- Zcash's Halving: A Fresh Start or the Beginning of the End?
- How to Run a Node on the World Mobile Network: A Guide to Earning with $WMTx
- Exploring CoinEx AMM: A Guide to Automated Market Making and Enjoy High Earning Potential
- The Future of Kaspa: An Overview of KANGO, DOGK, and KDAO on CoinEx
- Best Crypto Cards 2024: Top Picks for Rewards, Fees, and Benefits
- Understanding the Fed: Key Inflation and Employment Indicators
- Privacy Coins and Their Future in DeFi: Navigating Anonymity and Regulation
- Blockchain Meets Formula 1: Inside Billion Dollar Jackpot’s Interactive Racing Platform
- Sony's Soneium and Its Vision for Web 3 Innovation Might Chart a New Era
- Crypto Airdrops: Best Upcoming Crypto Airdrops List October 2024
- Qubetics: Revolutionizing Blockchain Interoperability and Security
- Exploring the Hemi Network: A New Era of Cross-Chain Interoperability
- Crypto Airdrops: Best Upcoming Crypto Airdrops List September 2024
- What Is Fortnite BRICK (BRICK)?
- Is There Any Way You Can Claim Crypto Loans Without Collateral?
- Byzantine Fault Tolerance Explained
- Babylon: Scaling Bitcoin to Strengthen the Proof-of-Stake
- XEL Cryptocurrency: Deep Dive into the XELIS Project
- SUI Pumps More than 140%: Here Are Its Ecosystem Coins Which Could Be Next
- Evolution of Smart Contract Auditing: How CertiK Is Innovating Web3 Security
- Farcaster: A Protocol for Building Sufficiently Decentralized Social Networks
- Gold Standards: Olympian Values Meet Crypto Expertise
- Sports Fever: Applications of Blockchain in Sports Industry and Future Development
- The Paris 2024 Olympics Begins: 6 Sports Coins and Tokens You Should Know
- Top Derivative Projects on the Blast Network: A Comprehensive Overview
- Crypto Meets Olympics: What to Expect?
- M2E and Paris Olympics: What to Expect?
- FHE Is the New Black to Crypto Security
- How to Maximize the Returns on Your Liquidity Pool Investment?
- PUPS Is Going from Ordinals to Runes, Here's Why
- RWA Tokenization: How Far Would It Go?
- ENS Tokens Explode After Vitalik's Endorsement - What's Driving the Rally?
- How Web3 Marketing Is Evolving?
- Crypto Lending: How Can You Incentivize Your Crypto Holdings
- Solscan Blockchain Explorer: What Can You Track?
- Can Retail Investors Benefit from the Huge Profits of MEV Arbitrage?
- Binance’s Quiet Triumph in Cold Wallet, What Makes SafePal Sell Well All Over the World?
- AMM, Leaving the Liquidity of Digital Assets More Possibilities
- Compound2.0? How Did the Anonymous Team PowerPool Draw So Much Attention?
-
- Airdrop Guide
- Cables Finance Airdrop Guide: Free Token & How to Participate
- Mitosis (MITO) Airdrop Guide: Launched on April 29, 2025, Free Tokens & How to Participate
- NORA Airdrop Guide: How to Participate and Earn Rewards
- daGama Airdrop Guide: Earning $DGMA Tokens Through Location-Based Content Creation
- The Airdrop Guide of OKTO x Hyperone: Earning HYPE Tokens Through Mobile Trading
- The Airdrop Guide of OKTO x Hyperone: Earning HYPE Tokens Through Mobile Trading
- The Airdrop Guide of CoinRaces: Earning $CRGG Tokens Through Meme Coin Predictions
- The Airdrop Guide to Warden Protocol: Earning $WARD Tokens Through AI-Powered Activities
- Crypto Airdrop Dates & Price Predictions for Nigeria 2025
- The Airdrop Guide of Zama: Earning ZAMA Tokens Through Testnet Participation
- The Airdrop Guide of Ethereal: Earning Potential Tokens Through Trading and Referral
- The Airdrop Guide of Pump.fun: Earning $PUMP Tokens Through Meme Coin Trading
- Onchain Heroes Airdrop: Step-by-Step Guide to Earn Free HERO Tokens
- Tanssi Network Airdrop: Step-by-Step Guide to Earn Free TANSSI Tokens
- The Airdrop Guide of Camp Network: Unlocking Rewards in a Pioneering Layer-1 Blockchain
- Arch Network Airdrop: Step-by-Step Guide to Earn Free Arch Tokens
- The Airdrop Guide of Ostium: Earning Potential Tokens Through Trading and Referrals
- The Airdrop Guide of Upshift DeFi: Earning Points Through Vault Deposits
- The Airdrop Guide of X365.ai: Earning $X365 Tokens Through Quantum Mining
- Airdrop Guide LayerEdge: Earn EDGEN Tokens Through Testnet Participation
- The Airdrop Guide of Arcium Citadel: Earning ARC Tokens Through Confidential Computing
- The Airdrop Guide of TradeGX: Earning Rewards with AI-Driven Trading Tools
- The Airdrop Guide of Solix DePIN: Earning SLIX Tokens Through Bandwidth Sharing
- The Airdrop Guide of BoxBet: Earning BXBT Tokens Through Casino Betting
- The Airdrop Guide of 3DOS: Step-by-Step Instructions to Earn Free $3DOS Tokens
-
- Trading Knowledge
- What's New
- What Drives Seasonal Patterns in Crypto Trading?
- Why Do Pro Traders Combine RSI & Bollinger Bands?
- What Are Bill Williams’ Key Trading Tools?
- Overbought Signals: RSI vs. Stochastic vs. Williams
- Double Tops and Bottoms: A Primer for Crypto Traders
- Money Flow Index (MFI) in Crypto: A Trader’s Tool
- Beat FUD: Can You Trade Without Fear?
- Renko or Heikin-Ashi: Smarter for BTC Trades?
- Harmonic Patterns in Crypto: A Trader’s Guide
- Black-Litterman Model in Crypto Trading
- Markowitz & Crypto: Maximize Returns, Cut Risk
- Commodity Channel Index (CCI) in Crypto Trading
- Crypto Quantitative Trading: A Beginner's Guide
- What Is KDJ Indicator in Crypto?
- Crypto Performance Review: Boost Your Trading Strategy
- Martingale Strategy in Crypto: Risks & Rewards
- Sentiment Analysis in Crypto Trading Explained
- Top 5 Crypto Indicators for Profitable Trading
- What Is Grid Trading in Crypto?
- Risk Management in Crypto Trading: A Complete Guide
- Momentum Channels in Crypto Trading Explained
- Mastering Ichimoku Cloud in Crypto Trading
- Mastering Price Channels: A Trader's Guide for All Markets
- Bollinger Bands Explained: Crypto Trading Strategies
- High-Frequency Trading in Crypto: Strategies and Practical Insights
- Understanding and Applying the Donchian Channel (DC) in Trading
- Aroon Indicator: A Powerful Tool for Trend Detection
- Mastering DMA: A Strategic Approach to Trend Analysis
- Understanding and Applying the TRIX Indicator in Trading
- Dynamic Asset Allocation in Crypto Trading
- What Is Relative Strength Index (RSI)?
- Mastering Market Volatility: A Guide to the ATR Indicator
- Understanding and Applying the DMI Indicator in Trading
- What Are Triangle Chart Patterns in Crypto Trading?
- Understanding and Applying the Keltner Channel Indicator in Trading
- Understanding and Applying the MOM Indicator in Trading
- Enhancing Cryptocurrency Market Analysis and Prediction Using Kalman Filters
- Mastering Parabolic SAR in Crypto Trading
- What Is the Stochastic Oscillator in Crypto Trading?
- How Does Fibonacci Retracement Work in Crypto Trading?
- Mastering Average Directional Index (ADX) in Crypto
- Triangular Arbitrage in Cryptocurrency Markets
- Understanding and Applying the Williams %R Indicator in Trading
- Understanding On-Balance Volume (OBV) in Crypto Trading
- Scenario Planning in Crypto Trading: Enhance Investment Strategies
- What Is Statistical Arbitrage in Cryptocurrency?
- What Are Advanced Volume Indicators in Crypto Trading?
- What Is MACD in Crypto Trading?
- Position Sizing in Crypto Trading: Managing Risk for Maximum Returns
- How Does Dow Theory Apply to Crypto Trading?
-
- Core Foundations
- Sentiment Analysis in Crypto Trading Explained
- What Is Grid Trading in Crypto?
- Risk Management in Crypto Trading: A Complete Guide
- High-Frequency Trading in Crypto: Strategies and Practical Insights
- Dynamic Asset Allocation in Crypto Trading
- Triangular Arbitrage in Cryptocurrency Markets
- Understanding On-Balance Volume (OBV) in Crypto Trading
- What Are Advanced Volume Indicators in Crypto Trading?
- Position Sizing in Crypto Trading: Managing Risk for Maximum Returns
- How Does Dow Theory Apply to Crypto Trading?
- What Is Swing Trading in Crypto Markets?
- Understanding Volume Analysis: A Key for Smart Trading Decisions
- Mastering the Trendline Trading Strategy
- Scalping Indicators: A Comprehensive Guide for Crypto Traders
- Understanding Crypto Trading Signals: A Guide to Smarter Trading
- Mastering Japanese Candlestick Charting Techniques
- Understanding Trading Charts: Line, Bar, and Candlestick Charts
- What Are Higher Highs, Higher Lows, Lower Highs, and Lower Lows?
- What Is Bitcoin Rainbow Chart?
- Crypto Chart Patterns: A Comprehensive Guide for Novice Traders
- What Is Open Interest in Crypto?
- Dollar Cost Averaging DCA Meaning
- What Is Wyckoff Accumulation?
- What Is Hammer Candlestick?
- What Is a Candlestick?
-
- Trend Analysis
- What Are Bill Williams’ Key Trading Tools?
- Aroon Indicator: A Powerful Tool for Trend Detection
- Mastering DMA: A Strategic Approach to Trend Analysis
- Understanding and Applying the TRIX Indicator in Trading
- What Is Relative Strength Index (RSI)?
- Understanding and Applying the DMI Indicator in Trading
- Understanding and Applying the MOM Indicator in Trading
- Mastering Parabolic SAR in Crypto Trading
- What Is the Stochastic Oscillator in Crypto Trading?
- Mastering Average Directional Index (ADX) in Crypto
- Scenario Planning in Crypto Trading: Enhance Investment Strategies
- What Is MACD in Crypto Trading?
- Understanding Support and Resistance in Crypto Trading
- Understanding Technical Analysis: Stochastic RSI
-
- Price Channels
- Why Do Pro Traders Combine RSI & Bollinger Bands?
- Overbought Signals: RSI vs. Stochastic vs. Williams
- Money Flow Index (MFI) in Crypto: A Trader’s Tool
- Mastering Ichimoku Cloud in Crypto Trading
- Commodity Channel Index (CCI) in Crypto Trading
- What Is KDJ Indicator in Crypto?
- Momentum Channels in Crypto Trading Explained
- Mastering Price Channels: A Trader's Guide for All Markets
- Bollinger Bands Explained: Crypto Trading Strategies
- Mastering Market Volatility: A Guide to the ATR Indicator
- Understanding and Applying the Keltner Channel Indicator in Trading
- Understanding and Applying the Donchian Channel (DC) in Trading
- Enhancing Cryptocurrency Market Analysis and Prediction Using Kalman Filters
-
- Market Patterns
- Double Tops and Bottoms: A Primer for Crypto Traders
- Renko or Heikin-Ashi: Smarter for BTC Trades?
- Understanding and Trading the Evening Star Candlestick Pattern
- Harmonic Patterns in Crypto: A Trader’s Guide
- What Are Triangle Chart Patterns in Crypto Trading?
- Understanding and Trading the Morning Star Candlestick Pattern
- What Is the Divergence Pattern and How Does It Work?
- What Are Bearish Harami and Bullish Harami Candlestick Patterns?
- Mastering Bull and Bear Flag Patterns in Crypto Trading
- Dead Cat Bounce in Crypto Trading: What You Need to Know
- Decoding Long Wick Candlesticks: A Beginner’s Path to Smart Crypto Trading
- Mastering the Engulfing Candle: A Novice Trader's Guide to Reversals
-
- Others
- What Drives Seasonal Patterns in Crypto Trading?
- Beat FUD: Can You Trade Without Fear?
- Understanding Elliott Wave Theory
- Black-Litterman Model in Crypto Trading
- Markowitz & Crypto: Maximize Returns, Cut Risk
- Crypto Quantitative Trading: A Beginner's Guide
- Crypto Performance Review: Boost Your Trading Strategy
- Martingale Strategy in Crypto: Risks & Rewards
- What Is Statistical Arbitrage in Cryptocurrency?
- Top 5 Crypto Indicators for Profitable Trading
- How Does Fibonacci Retracement Work in Crypto Trading?
- Understanding and Applying the Williams %R Indicator in Trading
- The Evolution of Automated Trading Bots in Crypto Markets
- What Is the Chop Zone Indicator and How Does It Work?
-
- Security Tips
- What's New
- Telegram Crypto Scams 2025: How to Stay Safe and Avoid Fraud
- List of Fake Crypto Exchanges on Telegram in 2025: 10 Scams to Avoid
- What Are Airdrop Scams and How to Avoid Them in 2025?
- What Are Sandwich Attacks Costing DeFi Users?
- Beat Address Poisoning: Wallet Security Tips
- AI Trading Bot Scams: Real Risks & How to Avoid
- Avoid Crypto ATM Scams: Expert Tips
- How to Spot Investment Scams in 2025?
- Copy Trading: Win with Less Risk
- Zero-Click Attacks: Invisible Crypto Danger?
- Is Bitcoin Payment Processing Safe for Businesses?
- Are Cryptocurrency Payments Safe? A Guide to Security, Risks, and Best Practices
- Risks and Challenges of Crypto Trading: A Guide for Smart Traders
- Memecoin Safety: Store & Trade Securely
- DeFi Safety: Guard Your Crypto Wealth
- How Double-Checking Wallet Addresses Prevents Costly Crypto Mistakes
- How to Avoid Crypto Wallet Scams Safely?
- How to Protect Your Crypto Mining Assets?
- Multisig Wallets: Boost Crypto Security Now
- Custodial vs Non-Custodial Wallets: Security Risks and How to Choose the Right One
- How to Prevent and Recover from Crypto Ransomware Attacks?
- The Truth About Xgane Crypto: Signs It’s a Dangerous Crypto Scam
- The Security Implications of Using DeFi Protocols
- Cross-Chain Risks: How to Protect Crypto Assets
- How to Avoid Crypto Fraud in Peer-to-Peer Transactions
- Is Your Crypto Identity Secure? Best Practices
- Cross-Chain Hacks: How to Secure Your Assets
- AI Voice Scams Explained: How to Detect, Block, and Prevent
- 2025 Q1 Crypto Security Events: Risks & Investor Safety Guide
- How to Protect Your Funds on Decentralized Exchanges (DEXs)?
- Best Practices for Managing Private Keys: A Comprehensive Guide
- Why Exchange Hacks Persist & How Traders Can Stay Secure
- Best Practices for Securing Crypto Staking Operations
- How to Recover a Lost Crypto Wallet as an Investor
- Best Security Habits for Long-Term Crypto Investors
- Crypto Scams: How to Spot Fake Tokens Easily
- How Do You Secure Your Crypto Remittance Transactions?
- How to Safely Participate in Crypto Airdrops: A Comprehensive Guide
- How to Safely Participate in Crypto Forums?
- How to Protect Your Crypto from Fake Support?
- How to Secure Your Crypto Portfolio?
- How to Protect Your Crypto from Social Media Scams?
- Protecting Your Crypto: How to Spot Fake Cryptocurrency Exchanges
- Cybersecurity Best Practices for Cryptocurrency Investors
- Security Considerations for Investing in Initial Coin Offerings (ICOs)
- Why Should You Avoid Reusing Passwords in Crypto?
- Crypto Wallet Security Tips: Safeguard Your Assets
- Preventing Social Engineering Attacks in Crypto
- Pig Butchering Crypto Scams: How to Spot and Avoid Them
- Crypto Security: 5 Essential Strategies to Protect Your Digital Assets in 2024
- Attack Prevention
- What Are Sandwich Attacks Costing DeFi Users?
- Zero-Click Attacks: Invisible Crypto Danger?
- How to Prevent and Recover from Crypto Ransomware Attacks?
- The Security Implications of Using DeFi Protocols
- Cross-Chain Hacks: How to Secure Your Assets
- Preventing Social Engineering Attacks in Crypto
- Cryptojacking Explainer: Prevent, Detect, and Recover from It
- Understanding DDoS Attacks: Mechanisms, Impacts, and Defenses
- How to Get Rid of Dust Attack?
-
- Asset Safeguarding
- Memecoin Safety: Store & Trade Securely
- DeFi Safety: Guard Your Crypto Wealth
- How to Protect Your Crypto Mining Assets?
- Custodial vs Non-Custodial Wallets: Security Risks and How to Choose the Right One
- Crypto Security: 5 Essential Strategies to Protect Your Digital Assets in 2024
- How to Secure Your Crypto Portfolio?
- Comparing Different Crypto Storage Solutions and Their Security Implications
- Essential Security Features to Look for in Crypto Exchanges
-
- Fraud Identification
- List of Fake Crypto Exchanges on Telegram in 2025: 10 Scams to Avoid
- What Are Airdrop Scams and How to Avoid Them in 2025?
- AI Trading Bot Scams: Real Risks & How to Avoid
- Avoid Crypto ATM Scams: Expert Tips
- How to Spot Investment Scams in 2025?
- Telegram Crypto Scams 2025: How to Stay Safe and Avoid Fraud
- The Truth About Xgane Crypto: Signs It’s a Dangerous Crypto Scam
- How to Avoid Crypto Fraud in Peer-to-Peer Transactions
- AI Voice Scams Explained: How to Detect, Block, and Prevent
- Crypto Scams: How to Spot Fake Tokens Easily
- How to Safely Participate in Crypto Airdrops: A Comprehensive Guide
- How to Safely Participate in Crypto Forums?
- How to Protect Your Crypto from Fake Support?
- How to Protect Your Crypto from Social Media Scams?
- Protecting Your Crypto: How to Spot Fake Cryptocurrency Exchanges
- Security Considerations for Investing in Initial Coin Offerings (ICOs)
- Pig Butchering Crypto Scams: How to Spot and Avoid Them
- The Rise of Crypto Scams: How to Identify and Avoid Rug Pulls
- Latest Crypto Scams and How to Avoid Being a Victim
- The TON Phishing Flood on Telegram: How to Safeguard Your Investment
-
- Safe Trading
- Copy Trading: Win with Less Risk
- Risks and Challenges of Crypto Trading: A Guide for Smart Traders
- Secure Crypto Trading: Avoid Public Wi-Fi Risks
- Cross-Chain Risks: How to Protect Crypto Assets
- Is Your Crypto Identity Secure? Best Practices
- Why Exchange Hacks Persist & How Traders Can Stay Secure
- How Do You Secure Your Crypto Remittance Transactions?
- Tips for Secure Cryptocurrency Trading on Mobile Devices
-
- Wallet Security
- Beat Address Poisoning: Wallet Security Tips
- How Double-Checking Wallet Addresses Prevents Costly Crypto Mistakes
- How to Avoid Crypto Wallet Scams Safely?
- Multisig Wallets: Boost Crypto Security Now
- Best Practices for Cryptocurrency Wallet Security
- Best Practices for Managing Private Keys: A Comprehensive Guide
- How to Recover a Lost Crypto Wallet as an Investor
- Crypto Wallet Security Tips: Safeguard Your Assets
- How to Securely Manage Your Hardware Wallet?
-
- Others
- Is Bitcoin Payment Processing Safe for Businesses?
- Are Cryptocurrency Payments Safe? A Guide to Security, Risks, and Best Practices
- 2025 Q1 Crypto Security Events: Risks & Investor Safety Guide
- How to Protect Your Funds on Decentralized Exchanges (DEXs)?
- Best Practices for Securing Crypto Staking Operations
- Best Security Habits for Long-Term Crypto Investors
- Cybersecurity Best Practices for Cryptocurrency Investors
- Why Should You Avoid Reusing Passwords in Crypto?
- The Importance of Two-Factor Authentication in Crypto Security
- Smart Contract Security in Web3: Protecting Cross-Chain Transactions from Emerging Threats
- Account Abstraction: The Key to Securing Web3 for the next Billion Users
-
- Crypto Stories
- 2025 Mid-Year Crypto Trends: Wins, Losses & Forecasts
- The Best Crypto Memes of June 2025: Humor, Culture, and the Pulse of the Crypto Community
- Biggest Cryptocurrency Achievements in May 2025 You Need to Know
- Sui Ecosystem Hacked: How the $260M Cetus Hack Exposes Risks and Boosts Ethereum’s Post-Pectra Appeal
- Major Crypto Milestones Achieved in 2025 Q1
- Major Crypto Milestones Achieved in 2024
- Major Crypto Moves in 2023
- Significant 2022 Blockchain Developments
- 2021 Crypto Market Recap
- Key Crypto Events in 2020
- 2019 Crypto Industry Highlights
- Top Crypto Breakthroughs of 2018
- What Happened to the Crypto Market in 2017?
- What happened to Bitcoin in 2017?
-
What Is Bitcoin Rainbow Chart?
The Bitcoin Rainbow Chart is a visual tool that provides an insightful representation of Bitcoin's historical price trends. Developed by a community of cryptocurrency enthusiasts, this chart uses a color spectrum to indicate different phases of Bitcoin's market cycles. The concept is based on the idea that Bitcoin's price, while volatile, follows certain long-term patterns that can be illustrated through a colorful logarithmic regression.
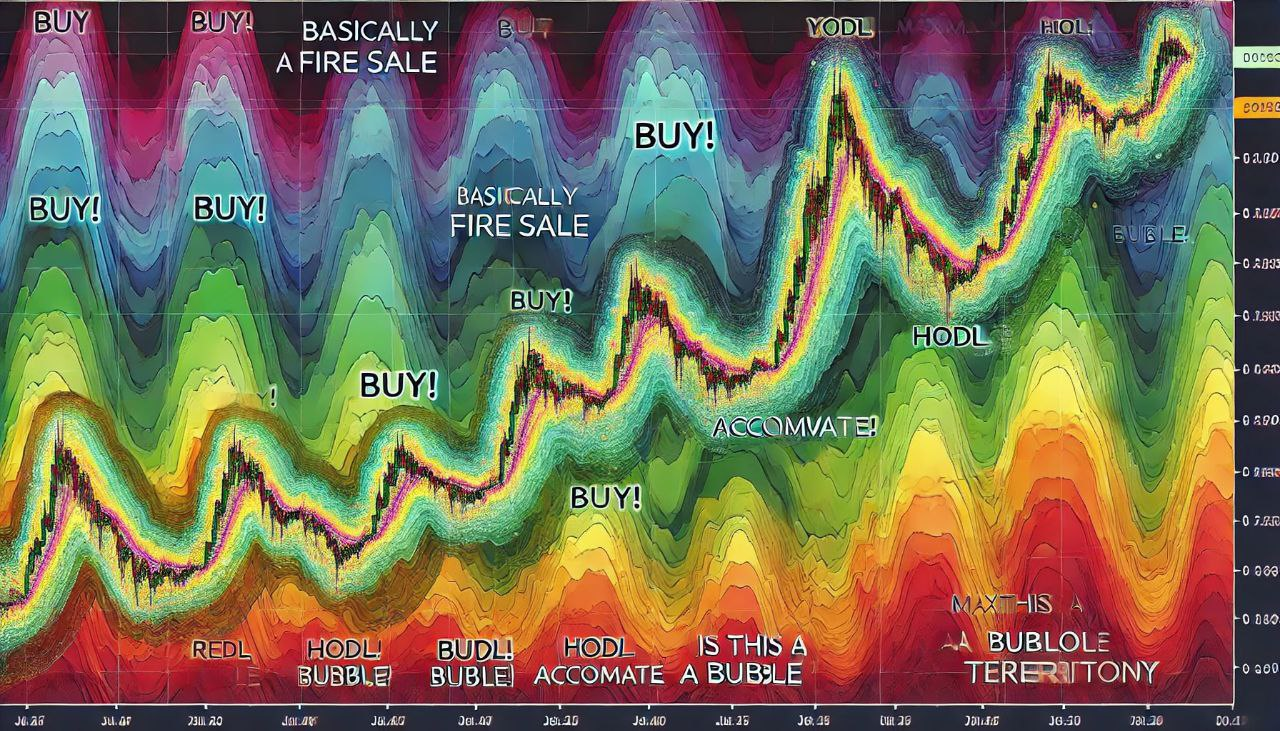
Key Indicators Insights & Indicators
The chart ranges from deep blue, representing "Basically a Fire Sale," to dark red, indicating "Maximum Bubble Territory." Each color band signifies a different market sentiment, helping investors gauge whether Bitcoin is underpriced, overpriced, or somewhere in between. The Rainbow Chart simplifies complex data into an easy-to-understand format, making it accessible to both novice and experienced investors.
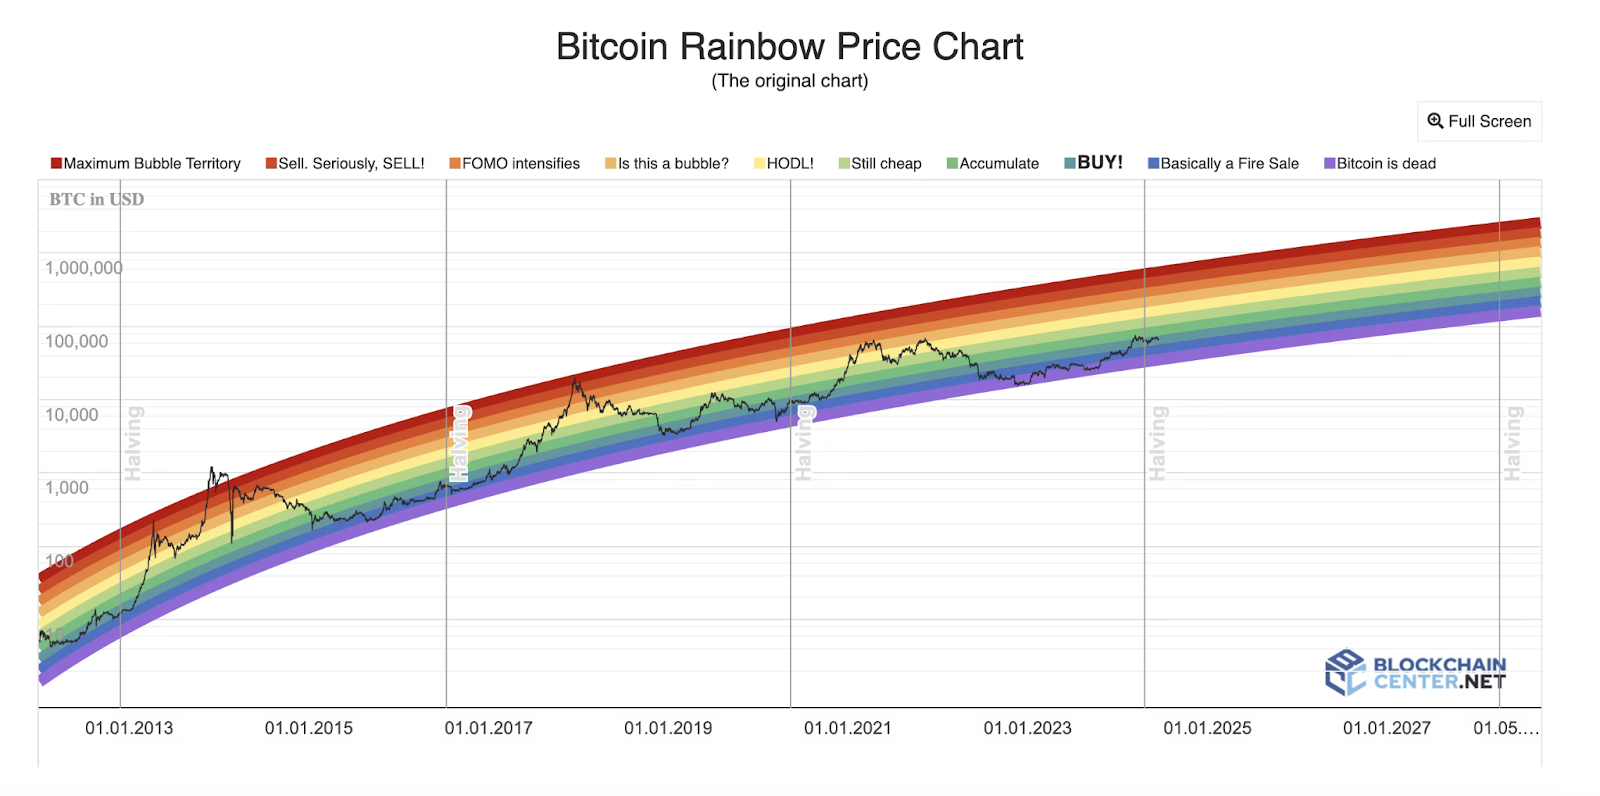
Here’s what the colors mean, according to the chart itself (Note: This is the chart’s specific wording):
- Purple: Bitcoin is Dead. RIP.
- Dark Blue: "Basically a Fire Sale" — Historically, can be a good time to buy.
- Teal: BUY!
- Green: "Accumulate" — Buying recommended.
- Light green: Still cheap! Potential for accumulation.
- Yellow: "HODL" — Hold your Bitcoin.
- Light Orange: "Is this a bubble?" — Proceed with caution.
- Dark Orange: "FOMO intensifies" — Fear of missing out drives prices higher.
- Red: "Sell. Seriously, SELL!" — Potential market peak.
- Maroon: Maximum bubble territory — sell everything and hide in a bunker.
History of the Bitcoin Rainbow Chart
The Bitcoin Rainbow Chart was introduced as a tool to simplify Bitcoin price analysis by applying a rainbow-colored gradient to historical price data. Its primary goal is to make it easier for users to understand Bitcoin’s price movements and market phases. The chart typically represents Bitcoin's price on a logarithmic scale, reflecting its long-term growth and volatility. The colors on the chart range from red, indicating high price levels, to blue, representing lower price levels, with intermediate colors showing various stages in between.
The chart’s origin can be traced back to early Bitcoin enthusiasts who sought a more intuitive way to visualize price trends. Over time, it has gained popularity among both novice and experienced investors due to its straightforward and visually appealing approach to analyzing market trends.
Current Usage and Popularity of Bitcoin Rainbow Chart
The Bitcoin Rainbow Chart is widely used by cryptocurrency enthusiasts and investors to assess Bitcoin's price trends. Its visual simplicity makes it an attractive tool for both beginners and experienced traders. The chart helps users identify potential buying and selling opportunities based on historical price trends and market cycles.
In recent years, the Bitcoin Rainbow Chart has gained popularity as more investors seek tools that provide a clear and easy-to-understand overview of market conditions. Its visual representation of price data allows users to quickly gauge whether Bitcoin is currently in an overvalued or undervalued state.
How to Use the Bitcoin Rainbow Chart in Trading?
Using the Bitcoin Rainbow Chart in trading involves analyzing the color-coded zones to determine the best times to buy or sell Bitcoin. Here’s a step-by-step guide on how to use the chart effectively:
- Identify the Current Zone: Check which color zone Bitcoin is currently in. This will give you an idea of whether Bitcoin is in a "buy" or "sell" zone based on historical trends.
- Compare Historical Data: Compare the current zone with historical patterns to see if Bitcoin is in a similar phase to past market cycles. This helps in understanding whether the current price level is high or low relative to historical data.
- Consider Additional Indicators: While the Bitcoin Rainbow Chart is a useful tool, it is essential to use it alongside other technical indicators and market analysis methods. Combining multiple tools will provide a more comprehensive view of the market.
- Make Informed Decisions: Based on the insights gained from the chart and additional analysis, make informed trading decisions. For example, if Bitcoin is in a "buy" zone, you may consider entering a position, while if it’s in a "sell" zone, it might be a good time to exit.
- Monitor Regularly: Regularly update and monitor the Bitcoin Rainbow Chart to track changes in market conditions and adjust your trading strategy accordingly.
Applications of the Bitcoin Rainbow Chart
The Bitcoin Rainbow Chart serves several purposes for investors and traders:
1. Simplifying Investment Choices
The primary purpose of the Bitcoin Rainbow Chart is to simplify investment decisions. By providing a visual representation of price trends and market conditions, the chart helps investors quickly assess whether Bitcoin is currently overvalued, undervalued, or fairly priced. This can be particularly useful for those who are new to cryptocurrency investing.
2. Long-Term Investment Strategy
The Bitcoin Rainbow Chart is particularly valuable for long-term investors. By analyzing the historical price data, investors can develop a long-term investment strategy based on past performance. This approach can help mitigate the risks associated with short-term market volatility.
3. Market Sentiment Analysis
The color bands on the chart also reflect market sentiment, which can be a powerful tool for investors. Understanding the market sentiment helps investors gauge the overall mood of the market and make better-informed decisions. For instance, if the chart indicates a strong buy sentiment, investors might consider increasing their Bitcoin holdings.
Limitations of the Bitcoin Rainbow Chart
While the Bitcoin Rainbow Chart is a useful tool, it is not without limitations:
- Historical Focus: The chart is based entirely on historical data, which may not always accurately predict future price movements.
- Simplification: The chart simplifies complex market dynamics, which may lead to oversimplified conclusions.
- Market Changes: Cryptocurrency markets are highly volatile and influenced by various factors, making it challenging to rely solely on historical data for future predictions.
Are There More Crypto Rainbow Charts?
Yes, there are rainbow charts available for other cryptocurrencies as well. Similar to the Bitcoin Rainbow Chart, these charts use color-coded gradients to represent different price levels and market phases for various digital assets. While the Bitcoin Rainbow Chart is the most well-known and widely used, other cryptocurrencies have their own versions tailored to their unique price histories and market dynamics.
These charts serve a similar purpose: to provide a visual representation of historical price trends and assist investors in making informed decisions. However, each chart is designed to reflect the specific characteristics and volatility of the respective cryptocurrency.
FAQs About Bitcoin Rainbow Chart
1. Can I use the Bitcoin Rainbow Chart for short-term trading?
While the Bitcoin Rainbow Chart can provide useful insights, it is primarily designed for long-term investment analysis. It helps investors understand broad market trends over time rather than offering precise signals for short-term trades. Traders should use additional tools and analyses for short-term market decisions.
2. Is the Bitcoin Rainbow Chart available for other cryptocurrencies?
Currently, the Bitcoin Rainbow Chart is specifically designed for Bitcoin. While similar concepts can be applied to other cryptocurrencies, each digital asset has unique market behaviours and trends. Custom charts would need to be developed for other cryptocurrencies to provide comparable insights.
3. Where can I access the Bitcoin Rainbow Chart?
The Bitcoin Rainbow Chart can be accessed on various cryptocurrency websites and forums. It is freely available to the public and can be found through a simple online search. Users should ensure they are viewing the most up-to-date version of the chart for accurate analysis.
4. How often is the Bitcoin Rainbow Chart updated?
The Bitcoin Rainbow Chart is typically updated regularly to reflect the latest market data. The frequency of updates can vary depending on the source. It is important to use a reliable and frequently updated version of the chart to ensure accurate analysis.
5. How should I use the Bitcoin Rainbow Chart for investment decisions?
When using the Bitcoin Rainbow Chart, consider it as one of many tools in your investment strategy. Use it to gain insights into historical price trends and market sentiments, but also conduct thorough research and consider other factors such as market news, economic indicators, and your own financial goals.
6. Is the Bitcoin Rainbow Chart now dead?
No, the Bitcoin Rainbow Chart is not dead. It remains a popular tool among cryptocurrency enthusiasts and investors to analyze Bitcoin's historical price movements and market sentiment. The chart's colorful design helps users quickly identify different market phases, aiding in investment decisions.
7. When and where to buy Bitcoin?
The best time to buy Bitcoin varies depending on market conditions and individual investment goals. Generally, investors look for periods of lower prices or corrections. Bitcoin can be purchased on various cryptocurrency exchanges such as CoinEx.
Conclusion
the Bitcoin Rainbow Chart is a valuable tool for Bitcoin investors, providing a visual representation of market trends and price levels. Its color-coded design simplifies complex data, making it easier for investors to assess market conditions. While it offers useful insights, it is best used in conjunction with other analytical methods to ensure well-rounded investment decisions.
CJB Crypto & XRP-Bitcoin Mining: A New Approach to Earning Passive BTC in 2025
2025-08-27 09:45:01
Why Is the Crypto Market Down Today Despite Fed Chair Powell's Dovish Jackson Hole Speech?
2025-08-25 09:05:53
Bitcoin Cash (BCH) Price Prediction 2025, 2026-2030
2025-08-21 09:17:17
Index
- Key Indicators Insights & Indicators
- History of the Bitcoin Rainbow Chart
- Current Usage and Popularity of Bitcoin Rainbow Chart
- How to Use the Bitcoin Rainbow Chart in Trading?
- Applications of the Bitcoin Rainbow Chart
- Limitations of the Bitcoin Rainbow Chart
- Are There More Crypto Rainbow Charts?
- FAQs About Bitcoin Rainbow Chart
- Conclusion